PAR Meters vs Smartphone Apps: Accuracy Compared

Table of Contents
- Quick Comparison Table
- Evaluation Criteria: What Actually Makes a Light Meter Accurate
- Head-to-Head: Sensor Physics
- Detailed Hardware and App Profiles
- Photobiology Essentials: DLI, PPFD, and Cosine Correction
- Frequently Asked Questions
- Lux to PPFD Converter Tool
- Ready to Choose Your Lighting Measurement Tool?
Quick Summary: Dedicated quantum PAR meters offer strong, manufacturer-verified spectral accuracy (Apogee’s MQ-500, for example, carries a published ±5% calibration uncertainty) across LED and HID spectra, while smartphone apps are a genuinely useful budget option, generally landing in a wider accuracy band when paired with a proper diffuser and used on broad-spectrum white LEDs. For precision canopy tuning, commercial yield work, or narrow-band red/blue lighting, a dedicated meter is still the safer bet. For hobbyists running full-spectrum white LEDs, an app like Photone is solid value.
Quick Comparison Table
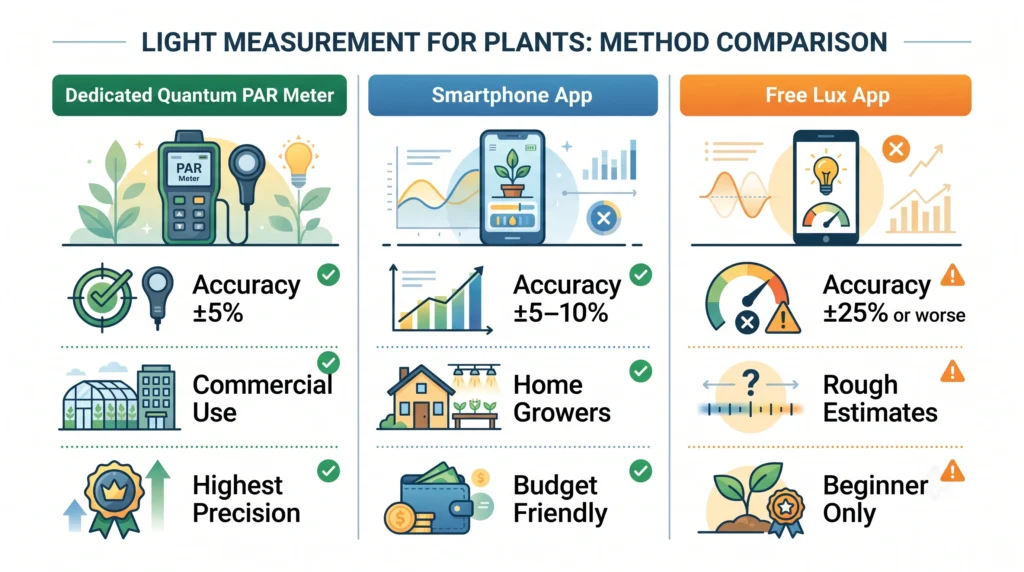
Choosing between a dedicated quantum PAR meter and a smartphone app comes down to budget, how much precision you actually need, and what kind of light spectrum you’re measuring. Dedicated hardware gives you a flat spectral response and physical cosine correction built in. Apps lean on camera sensor algorithms that need manual calibration and an external diffuser to get anywhere close.
| Feature / Metric | Dedicated Quantum PAR Meter (Apogee MQ-500) | Mid-Tier Quantum Meter (SpotOn AG-600) | Premium Smartphone App + Diffuser (Photone) | Free Lux Meter App (Uncalibrated) |
|---|---|---|---|---|
| Average Cost | $350 to $550 | $140 to $200 | $6 to $30 (app plus diffuser) | $0 |
| Manufacturer/Reported Accuracy (Broad-Spectrum LED) | ±5% (published calibration uncertainty) | Commonly reported around ±5% | Commonly reported ±5% to ±10% | Highly variable, often ±25% or worse |
| Accuracy (Blurple / Narrow Red-Blue) | Still ±5% per spec, though real-world error can run higher on extreme narrow-band sources | Similar caveat applies | Reported to degrade significantly, sometimes ±15% to ±30% | Generally unusable |
| Cosine Correction | Integrated acrylic dome diffuser | Integrated diffuser cap | Requires paper or clip-on diffuser | None |
| ePAR Support (400 to 750 nm) | Available on the ePAR MQ-610 model, not the base MQ-500 | Limited | Available via paid add-on | No |
| Sensor Drift Over Time | Under 2% per year (published spec) | Reported low, verify with manufacturer | Varies with phone hardware and wear | High |
| Ease of Field Use | Plug-and-play with telescoping wand | Handheld, direct sensor | Needs phone mount and diffuser prep | Handheld |
| Best Used For | Commercial CEA, research, narrow-band LEDs | Serious home growers, tent tuning | Hobby growers, full-spectrum LEDs | Rough ambient checks only |
Evaluation Criteria: What Actually Makes a Light Meter Accurate
Evaluating a light measuring tool comes down to sensor physics: spectral response, cosine (angular) response, linearity across a range of intensities, and how stable the calibration stays over time and temperature. These are the metrics that actually tell you whether a device is reading plant-usable photon flux, or just approximating human-eye brightness.
Spectral Response: PAR (400 to 700 nm) vs ePAR (400 to 750 nm)
Plants don’t see light the way human eyes do. Human vision peaks sharply around 555 nm (green light), which is what the standard lux measurement is built around. Plants use photons across the whole 400 to 700 nm range (Photosynthetically Active Radiation, or PAR) to drive photosynthesis. Extended PAR (ePAR) stretches that range out to 750 nm to account for far-red photons, which research on the Emerson enhancement effect shows work synergistically with shorter wavelengths to boost photosynthesis.
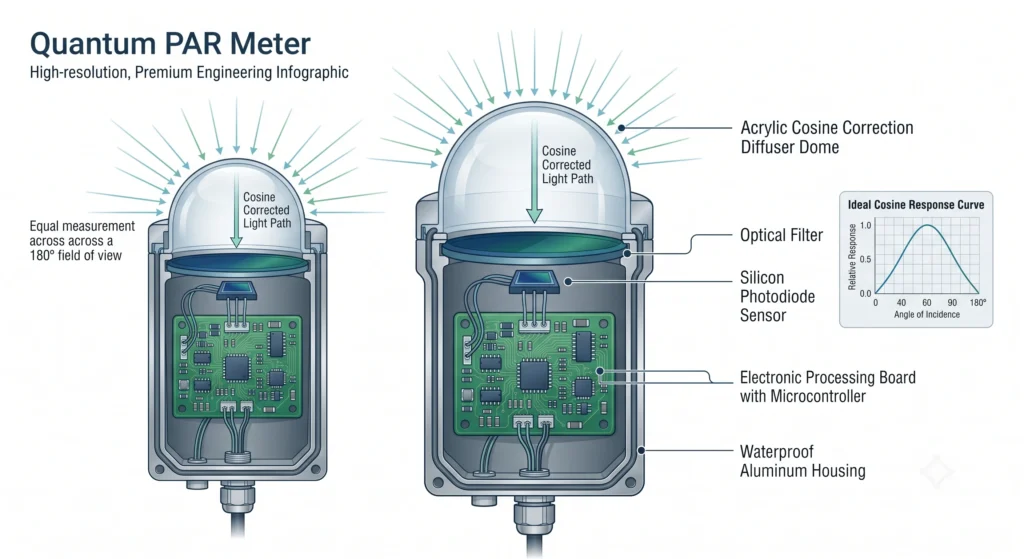
A true quantum sensor uses an optical filter over a solid-state photodiode to weight every photon in that range roughly equally, regardless of color. Cheap lux meters and uncalibrated smartphone cameras measure photopic lux instead, which overweights green light and underrepresents the deep blue and deep red wavelengths that actually drive a plant canopy.
Cosine Response (Angular Light Capture)
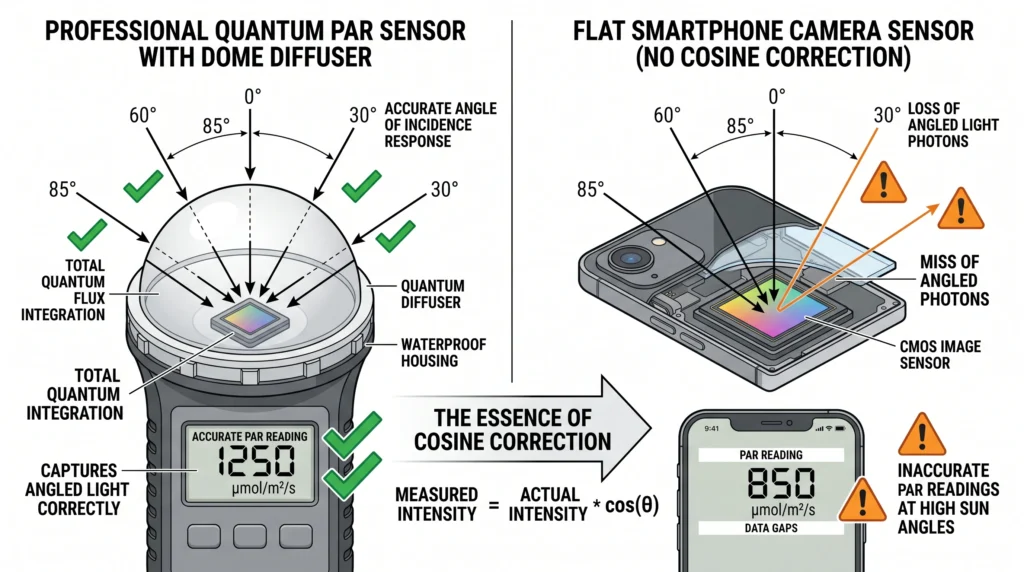
Light hits a canopy from a lot of angles, especially in a tent with reflective walls or a greenhouse with diffuse overhead light. A sensor’s cosine response describes how well it captures light arriving at an angle, following Lambert’s Cosine Law: intensity equals the source intensity times the cosine of the angle of incidence. Without a raised, diffused dome over the sensor, readings under-count light coming in at steep angles, which creates artificial hotspots directly under a fixture and false-looking drop-offs near the edges of a canopy.
Sensor Linearity and Dynamic Range
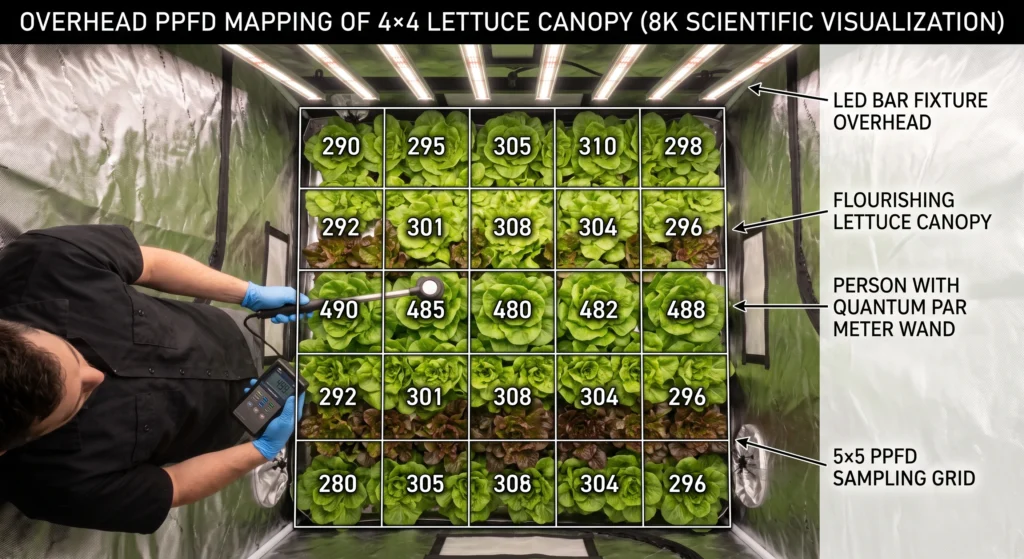
A good measuring tool needs to scale linearly from low seedling-stage intensities (around 50 µmol/m²/s) all the way up to high-intensity, CO2-enriched canopy levels (1,500 to 2,000 µmol/m²/s or more). A sensor that saturates or clips at high intensity will report flat readings even as actual output keeps climbing, which is a real problem if you’re running a high-PPFD commercial setup.
Calibration Stability and Temperature Drift
CMOS sensors in phones heat up during extended use, which shifts sensor gain and how the image processing pipeline handles color. Dedicated quantum meters use temperature-compensated photodiodes built to hold their calibration across typical grow room temperature swings.
Head-to-Head: Sensor Physics
Dedicated quantum meters use a physical optical filter and a calibrated photodiode to measure photon flux directly. Smartphone apps use the camera’s CMOS sensor combined with a software conversion model. Apps can get surprisingly close under broad-spectrum white LEDs, but the gap widens fast on narrow-band or unusual spectra.
Dedicated Quantum PAR Meters
Devices like the Apogee MQ-500 use an anodized aluminum housing topped with a domed acrylic diffuser. Underneath sits an optical filter and a silicon photodiode. The filter physically shapes the incoming light so the photodiode responds roughly equally to every photon across its rated 389 to 692 nm range. The output current from the photodiode scales directly with the number of incoming photons. Because the spectral weighting happens physically through the filter, there’s no software guesswork involved in the core measurement.
Smartphone Light Apps
Phones use CMOS image sensors built to take pleasing photos, not to measure physics. The sensor sits behind a Bayer filter array (a red, green, blue micro-filter mosaic), and the phone’s image signal processor constantly adjusts exposure, ISO, white balance, and tone curve in real time to make photos look good, which is exactly the opposite of what you want for a stable measurement.
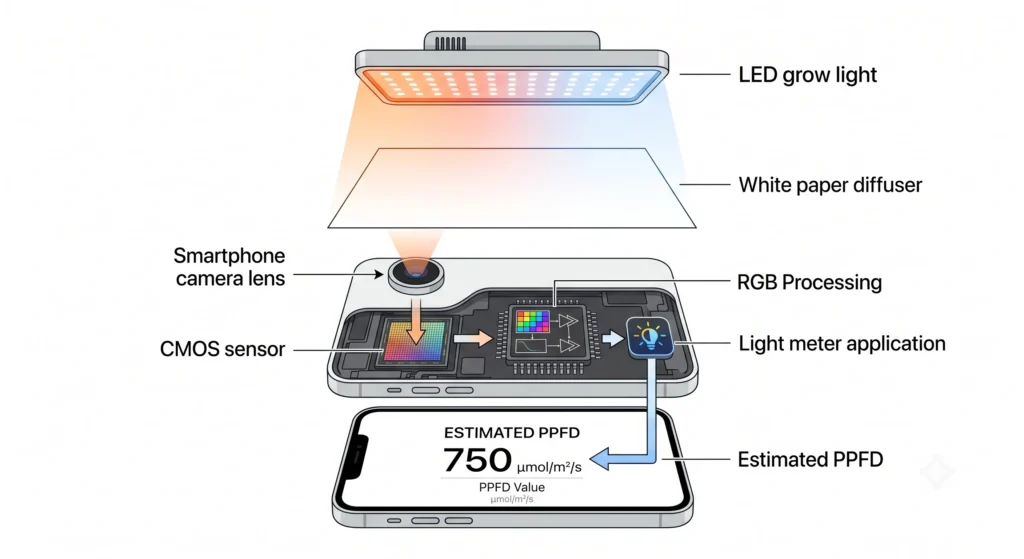
When an app like Photone converts camera data into a PPFD estimate, it locks exposure settings, reads raw RGB pixel values, and applies a weighting formula tuned to whatever light source profile you selected in the app, something like “white LED 3000K” or “HPS.” If you pick the wrong profile, or your fixture has an unusual spectral mix (added far-red or UVA diodes, for instance), that weighting breaks down and the error can get large fast.
The Diffuser Problem
A phone camera lens is flat, smooth glass. Light hitting it at an angle mostly reflects off rather than reaching the sensor, and lens vignetting naturally darkens the edges of the frame anyway. A diffuser, commonly a strip of plain printer paper or a clip-on plastic cap, scatters incoming light from all directions, roughly approximating the cosine correction a dedicated sensor gets for free from its dome. Without a diffuser, a phone app’s readings are directionally biased and not really usable for anything beyond a rough relative check.
The Lux-to-PAR Conversion Trap
A common budget move is taking a cheap lux meter reading and dividing by some constant to estimate PPFD. This only works loosely, and only if you’re using roughly the right constant for your specific light source, because the lux-to-PPFD relationship depends entirely on the spectral power distribution of that source.
Commonly cited approximate conversion factors:
- Sunlight: lux divided by about 54
- High-pressure sodium (HPS): lux divided by about 82
- Metal halide (MH): lux divided by about 71
- Warm white LED (3000K, high CRI): lux divided by about 62
- Cool white LED (6500K): lux divided by about 67
- Red/blue “blurple” LED: lux divided by somewhere around 38 to 45, and this one is genuinely unstable across different blurple fixtures
Using a single fixed conversion factor (say, 65) on a narrow-spectrum blurple or heavy far-red bar light can introduce real, meaningful error. If you’re troubleshooting canopy chlorosis or dialing in a precise target, that error can mean the difference between a healthy canopy and light stress in either direction. For more on translating PPFD into actual fixture placement, see our LED distance and PPFD guide.
Detailed Hardware and App Profiles
Individual profiles of the top hardware meters and leading apps show clear tradeoffs in cost, ruggedness, and accuracy. Comparing them side by side makes it obvious where a dedicated quantum sensor earns its price, and where an app is genuinely good enough.
Apogee Instruments MQ-500
The MQ-500 is generally treated as the benchmark other tools get measured against. It’s a handheld meter connected by cable to a cast-acrylic quantum sensor head.
- Calibration Uncertainty: +/- 5% (manufacturer published spec)
- Spectral Range: 389 to 692 nm
- Cosine Correction: acrylic diffuser dome
- Target User: commercial CEA, researchers, serious hobbyists

- DR BRUCE BUGBEE: Apogee PAR meters have been designed and refined by Dr. Bruce Bugbee, a world-famous crop physiologist.
- PREMIUM QUALITY: The MQ-500 is preferred by scientists and serious growers for accurate PAR measurements. Our meters sta…
- FEATURES: The rugged detector measures photosynthetic photons from 400-700 nm from any light source by taking instantane…
Pros:
Strong, manufacturer-verified accuracy (±5% published calibration uncertainty across the full PAR range). Good cosine response, which avoids the false edge-of-tent drop-off cheaper sensors show. The sensor head can be submerged (rated IP68) or mounted on a telescoping wand to reach into a dense canopy without the grower’s own body shadowing the reading.
Cons:
Real cost, north of $500 in most configurations. The base MQ-500 measures up to 692 nm, so capturing far-red beyond that requires stepping up to the ePAR MQ-610 model.
The Final Verdict:
Hard to beat for commercial operations, facility audits, or anyone running high-PPFD, CO2-enriched rooms where getting the number wrong actually costs money.
SpotOn AG-600 Quantum PAR Meter
A compact, one-piece alternative to Apogee, with the sensor built directly into the top of the handheld unit.
- Reported Accuracy: commonly cited around +/- 5% under standard grow lights
- Spectral Range: 400 to 700 nm
- Cosine Correction: integrated top diffuser
- Target User: serious home growers, craft cultivators
Pros:
Noticeably lower price than the MQ-500. Simple one-handed operation, with built-in DLI calculation and peak-hold.
Cons:
Because the sensor sits in the body of the unit, your own hand or arm can shadow it if you’re not careful about holding it at arm’s length, which matters more in tight vertical rack setups.
The Final Verdict:
A strong value pick for home growers who want real photodiode hardware without the full Apogee price tag.
Photone App
Formerly Korona, Photone has become the go-to app for home light testing. It uses profiles tuned to specific phone camera hardware, and iPhone cameras tend to be more standardized across a generation than the more fragmented Android hardware landscape, which reportedly makes iOS results a bit more consistent.
- Reported Accuracy: commonly cited +/- 5% to +/- 10% with a proper diffuser, on broad-spectrum LEDs
- Spectram: software-weighted based on the light profile you select
- Cosine Correction: requires a paper or clip-on diffuser
- Target User: home tent growers, casual tent tuning
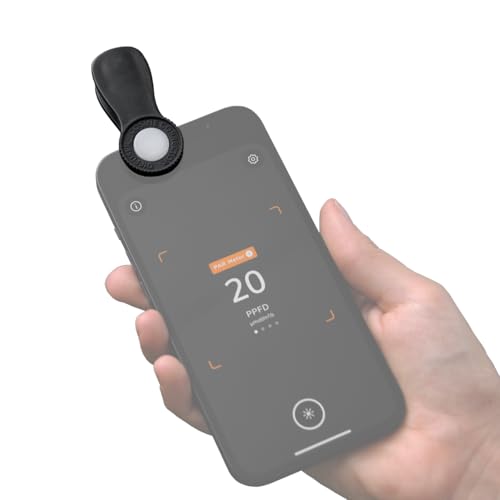
- ✅ Photosynthetically Active Radiation (PAR) as PPFD in μmol/m²/s
- ✅ Daily Light Integral (DLI) in mol/m²/d
- ✅ Illuminance in lux or foot-candles
Pros:
Very affordable. Reported to perform surprisingly well on broad-spectrum white LEDs when used correctly with a diffuser. Includes a built-in DLI calculator and photoperiod timer.
Cons:
Needs a properly built paper diffuser or the official diffuser cap to be usable at all. Accuracy is reported to drop meaningfully on narrow-band or unusual LED spectra. A scratched or dirty lens will throw off readings.
The Final Verdict:
A genuinely good option for most home hydroponic and tent growers running modern white-light LED bars, with the caveat that its accuracy claims come from user and manufacturer reports rather than independent lab testing as far as I could verify.
TentBuddy and Generic Light Meter Apps
Free apps like TentBuddy offer a no-cost lux-to-PAR conversion.
- Reported Accuracy: wide range, often cited from +/- 15% to +/- 35% or worse
- Spectram: general lux-based conversion
- Cosine Correction: none
- Target User: absolute beginners, quick rough checks
Lux Meter – Light & Exposure
Contechity AB
Precise smartphone light meter with built-in professional exposure calculator. Ideal for photography, plants, and lighting workflows.
Get on Google PlayPros:
Very affordable. Reported to perform surprisingly well on broad-spectrum white LEDs when used correctly with a diffuser. Includes a built-in DLI calculator and photoperiod timer.
Cons:
Needs a properly built paper diffuser or the official diffuser cap to be usable at all. Accuracy is reported to drop meaningfully on narrow-band or unusual LED spectra. A scratched or dirty lens will throw off readings.
The Final Verdict:
A genuinely good option for most home hydroponic and tent growers running modern white-light LED bars, with the caveat that its accuracy claims come from user and manufacturer reports rather than independent lab testing as far as I could verify.
Photobiology Essentials: DLI, PPFD, and Cosine Correction
Getting real value out of a PAR meter or app means converting an instant PPFD reading into Daily Light Integral, the total light your canopy actually receives over a full day.
MistCulture DLI Calculator
Calculate Daily Light Integral for your grow canopy
Practical DLI and PPFD Target Table
| Crop Category | Growth Stage | Target PPFD (µmol/m²/s) | Photoperiod (Hours) | Target DLI (mol/m²/day) |
|---|---|---|---|---|
| Microgreens & Sprouts | Germination/Early | 100 to 150 | 18 | 6 to 10 |
| Leafy Greens (Lettuce, Spinach) | Vegetative | 150 to 250 | 17 | 14 to 17 |
| Culinary Herbs (Basil, Mint) | Vegetative | 250 to 350 | 18 | 16 to 22 |
| Fruiting Crops (Tomato, Pepper) | Vegetative | 350 to 500 | 18 | 22 to 32 |
| Fruiting Crops (Tomato, Pepper) | Flowering | 600 to 900 | 12 | 25 to 38 |
| High-Light Specialty Crops | Veg, no CO2 | 500 to 700 | 18 | 32 to 45 |
| High-Light Specialty Crops | Flower, no CO2 | 800 to 1,000 | 12 | 35 to 43 |
| High-Light Specialty Crops | Flower, 1,200 ppm CO2 | 1,100 to 1,500 | 12 | 47 to 65 |
A practical note: if your meter shows 900 µmol/m²/s at canopy during flowering, but your room is sitting at 68°F with no supplemental CO2, your plants likely can’t process that much light. The excess tends to show up as photo-oxidation, bleached or yellowing top leaves. Either dim the light or raise CO2 and temperature to match what the light is actually delivering. For more on integrating environmental sensors, see our hydroponic sensor guide.
Frequently Asked Questions
Can a smartphone app really replace a $500 PAR meter?
For hobby growers running broad-spectrum white LEDs (3000K to 5000K, high CRI), an app like Photone used with a proper diffuser is commonly reported to land within a reasonable range of a professional meter’s readings. For commercial work, narrow-band red/blue lighting, or far-red supplemented fixtures, a dedicated quantum meter is still the safer choice.
Why do I need a paper diffuser over my smartphone camera?
A bare phone lens is flat glass, and light hitting it at a sharp angle mostly reflects off rather than reaching the sensor. A diffuser scatters incoming light from all directions, roughly mimicking the cosine correction a dedicated sensor’s dome provides.
Is an iPhone camera more accurate than an Android phone for PAR testing?
Generally reported as somewhat more consistent, since Apple standardizes its camera hardware and image processing across a given generation, while Android devices span a much wider range of sensors and manufacturer-specific processing, which makes consistent app calibration harder across the board.
What’s the difference between PAR (400 to 700 nm) and ePAR (400 to 750 nm)?
Standard PAR covers 400 to 700 nm. Extended PAR (ePAR) stretches to 750 nm to capture far-red light, which research on the Emerson enhancement effect shows works synergistically with shorter wavelengths to boost photosynthesis. If your fixture has dedicated far-red diodes, a standard PAR meter simply won’t count those photons.
Why can’t I just use a cheap lux meter from the hardware store?
Lux meters are built around human vision, which is most sensitive to green light and comparatively blind to the deep blue and deep red wavelengths plants rely on heavily. A lux reading will meaningfully misrepresent the usable light coming off most grow lights.
What should I do if my readings show a big hotspot in the center of my tent?
If the center of your tent reads dramatically higher than the corners, your canopy is going to mature unevenly. Raising the fixture, or adding secondary bar lights to spread coverage, generally does more for total yield than a single very bright center point.
How often should I check PAR levels over my crop?
Whenever you change light height or dimming, or shift photoperiod between vegetative and flowering. Since PPFD increases sharply as canopy grows closer to the light (following the inverse square law), checking weekly during fast growth phases is a reasonable habit to avoid accidental light stress. Our u003ca href=u0022https://mistculture.com/hydroponic-troubleshooting-guide/u0022u003ehydroponic troubleshooting guideu003c/au003e and u003ca href=u0022https://mistculture.com/ph-ec-meter-showdown-2025/u0022u003epH and EC meter showdownu003c/au003e cover related instrumentation if you’re rebalancing your root zone at the same time.
Lux to PPFD Converter Tool
Use the tool below to convert a lux reading into an estimated PPFD, using the light-source-specific conversion factors covered above. Remember this is an estimate, not a substitute for a real quantum sensor reading, especially on narrow-band or mixed-spectrum fixtures.
Estimate PPFD from a lux reading using a conversion factor specific to your light source. This is an estimate based on commonly cited factors, not a substitute for a real quantum sensor, especially on narrow-band or mixed-spectrum LEDs.
Conversion factors are commonly cited approximations and vary by specific fixture. For blurple/narrow-band LEDs especially, treat this as a rough estimate only, error can be substantial. A dedicated quantum PAR meter is the reliable option for anything beyond a ballpark check.

Continue Your Learning Journey