Mastering Grow Light Dimming Curves: The Science of Photoperiod Ramping

Table of Contents
- The End of the Binary Light Switch
- The Physiology Behind the Ramp: Why Stomata Can't Keep Up
- What a Dimming Curve Actually Looks Like
- Real-World Impact: Biomass, Tip Burn, and Energy Efficiency
- Industry Implications for LED Controller Dimming
- Affiliate Product Suggestions
- Frequently Asked Questions
- Ramp Curve Visualizer and Peak Compensation Calculator
- Conclusion
- Ready to Optimize Your Indoor Garden?
The End of the Binary Light Switch
Simulating a natural solar arc with grow light dimming curves changes how plants wake up and wind down for the day. Moving away from an abrupt on/off switch toward gradual photoperiod ramping can ease vapor pressure deficit (VPD) swings, work with the plant’s circadian rhythm instead of against it, and reduce the sharp morning energy spikes that make environmental control harder than it needs to be.
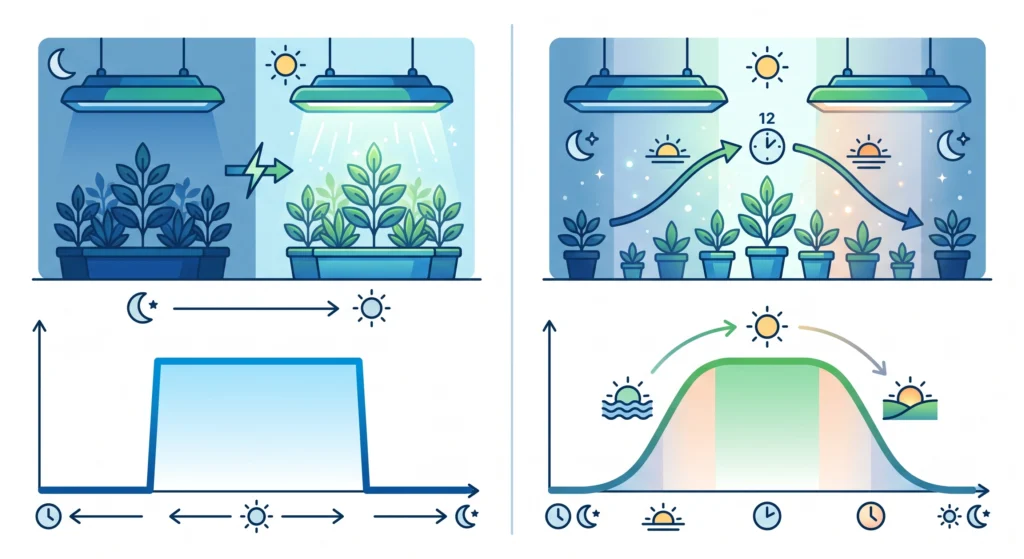
For decades, controlled environment agriculture has leaned on a pretty blunt tool to start the day: a timer and a contactor relay. At 6:00 AM the timer clicks, and plants go from total darkness to a full blast of maybe 1000 µmol/m²/s of light in an instant. Out in nature, dawn is nothing like that. It’s a slow gradient of shifting intensity and spectral quality that gently coaxes stomata open over the better part of an hour. Hitting a dormant canopy with full intensity light the moment it wakes up creates a real, if brief, physiological stress event every single day.
With digital LED drivers and 0-10V control now common, there’s no real reason to keep doing this the hard way. Modern led controller dimming lets growers build ramping schedules that roughly mimic the sun’s own irradiance curve. Sunrise sunset simulation grow lights have moved from a niche hobbyist trick to something a lot of commercial vertical farms now do as standard practice, mostly because easing a canopy into peak photosynthesis tends to stabilize HVAC load and can improve output for the same total energy input.
Legal Note: Regulations vary by location. Always consult local guidelines. This content is for educational purposes only.
The Physiology Behind the Ramp: Why Stomata Can’t Keep Up
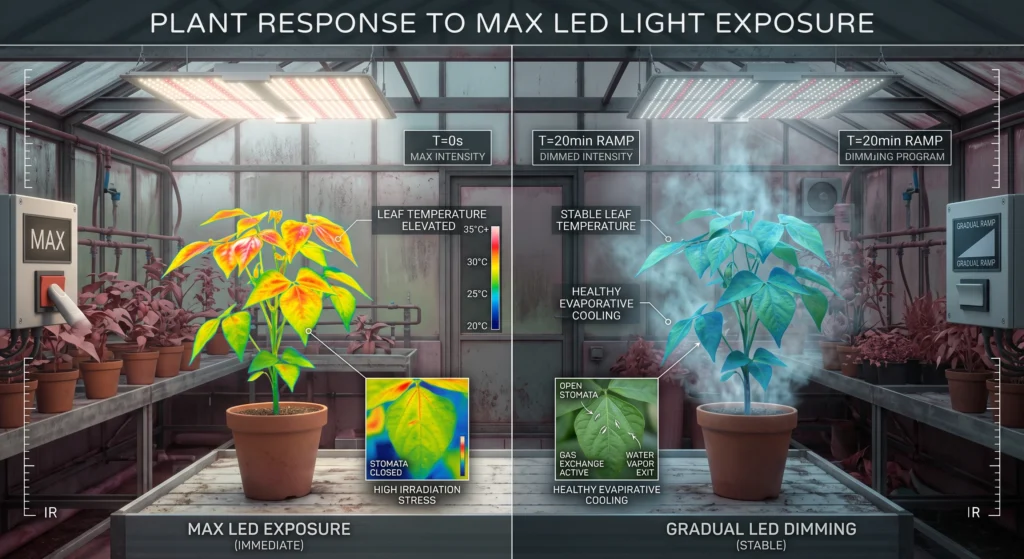
Stomata don’t open instantly when light hits a leaf. Published plant physiology research consistently shows a real lag between a light increase and full stomatal opening, and that lag is a big part of why an abrupt lights-on moment creates a short but real burst of heat stress on the canopy.
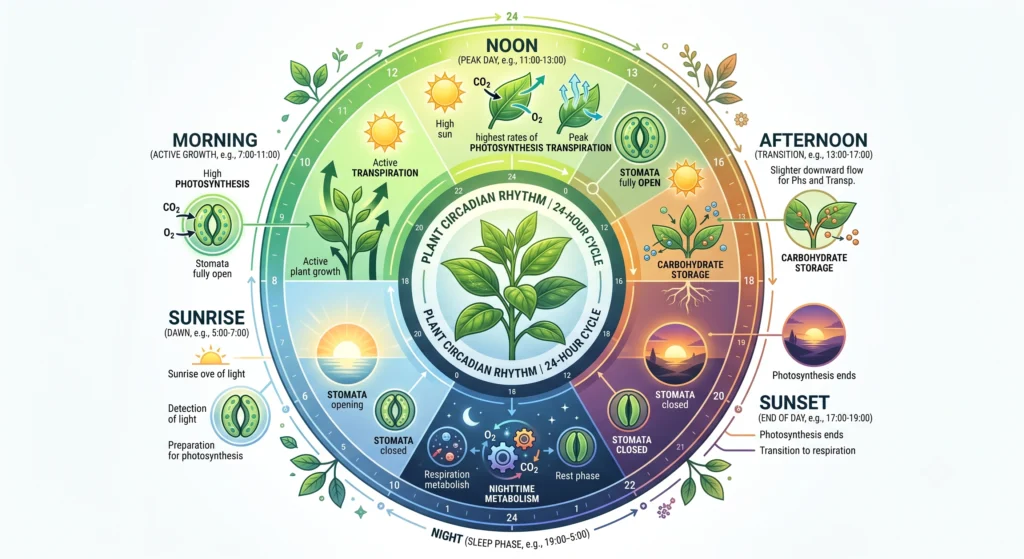
This isn’t a fringe claim. Multiple lines of published research confirm that stomatal responses to changing light are measurably slower than the plant’s photosynthetic response itself, sometimes by an order of magnitude. Guard cells have to physically change shape to open a stomatal pore, and that mechanical process simply takes time, typically tens of minutes to fully catch up after a sudden jump in light intensity.
There’s also a spectral piece to this. Blue light specifically drives a fast, low-threshold stomatal opening response that’s largely separate from the plant’s main photosynthetic machinery, and researchers believe this blue-light pathway is what’s mainly responsible for early morning stomatal opening under natural sunlight, where the spectrum is enriched in blue right at dawn. A pure high-PPFD blast from a fixture without that gradual blue-heavy dawn signal doesn’t give the plant the same head start.
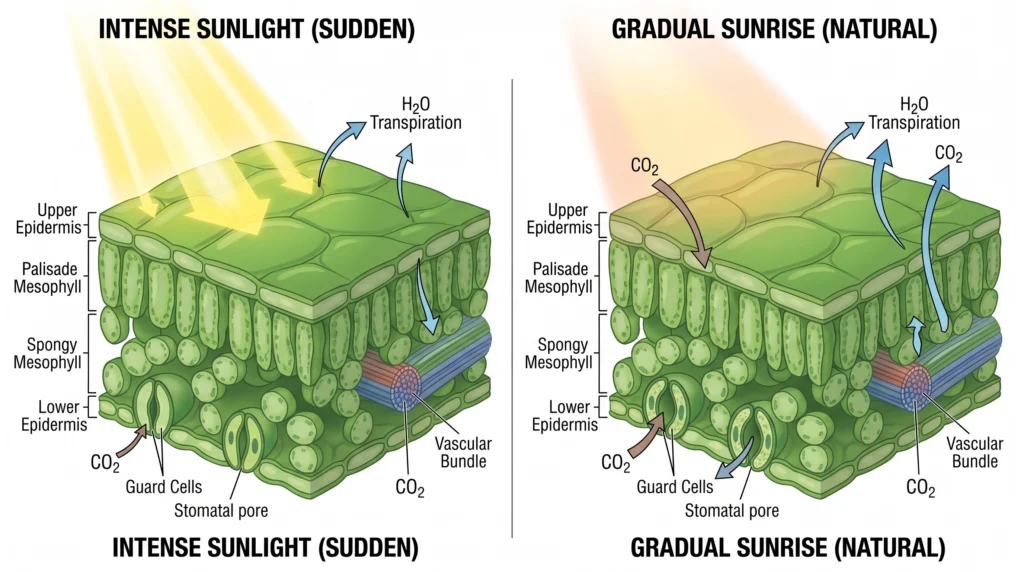
The practical result of all this: when a leaf gets hit with full intensity light instantly, its temperature can rise faster than the stomata are able to open and cool it through transpiration. That’s a real, if short-lived, heat stress event, and it happens every single morning on a binary on/off schedule.
Sources: · Stomatal response speed vs photosynthetic response, PMC · Blue and red light in stomatal dynamics, Journal of Experimental Botany
What a Dimming Curve Actually Looks Like
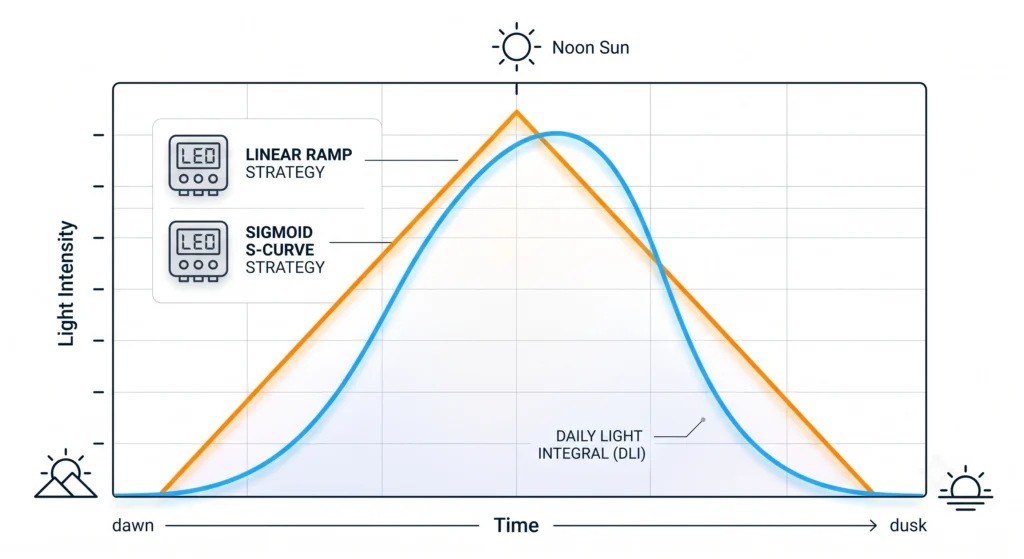
Most dimming controllers offer either a linear ramp, where intensity increases at a constant rate, or a sigmoidal (S-curve) ramp, which starts and ends gently and moves faster through the middle, more closely matching how natural light intensity actually changes around sunrise and sunset.
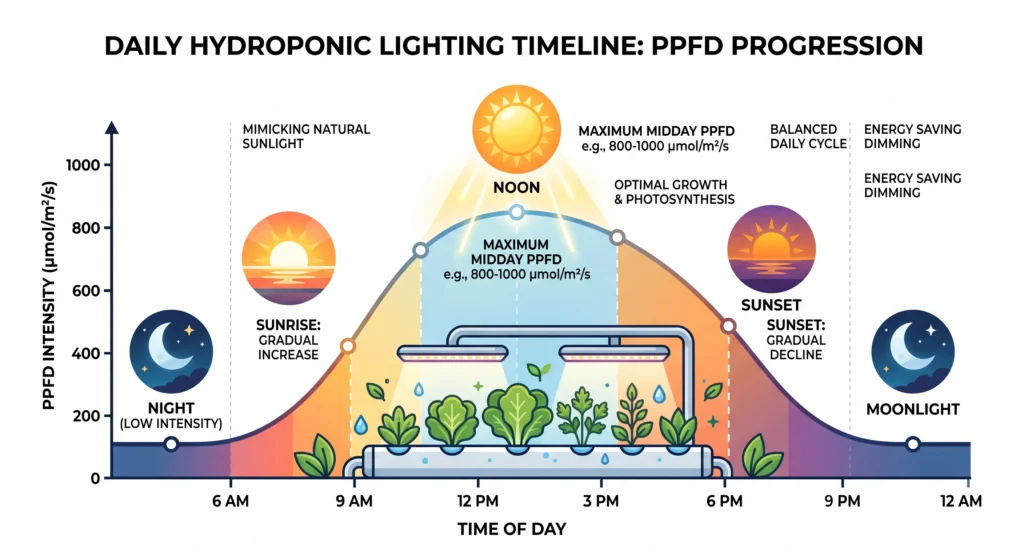
The two common approaches to a dimming curve:
Linear ramp. Intensity increases at a constant rate from 0% to 100% over your set ramp duration, commonly somewhere between 30 and 90 minutes. Simple to program, and a real improvement over an instant switch even if it isn’t a perfect match to natural light.
Sigmoidal (S-curve) ramp. Intensity follows a logistic-style curve: slow to start, faster through the middle of the ramp, then slow again as it approaches full intensity. This shape more closely resembles how light intensity actually changes during real sunrise and sunset, since atmospheric scattering means the sun’s effective intensity doesn’t increase in a straight line.
The general form of a sigmoidal ramp, if you’re programming a controller that supports a custom curve, is:
I(t) = I_max / (1 + e^(-k(t – t0)))
Where I_max is your target peak intensity, k controls how steep the curve is through the middle, and t0 is the midpoint of your ramp duration. Most commercial controllers handle this curve shape internally, you typically just set a ramp duration and pick “linear” or “S-curve” from a menu rather than programming the math yourself.
Either approach beats an instant switch. The S-curve is generally considered the closer match to natural light and to how stomata actually respond, but a simple linear ramp still removes most of the abrupt shock a binary schedule creates.
Real-World Impact: Biomass, Tip Burn, and Energy Efficiency
Photoperiod ramping doesn’t reduce total Daily Light Integral if you compensate correctly, and there’s a reasonable physiological case that avoiding morning light shock helps prevent calcium-related disorders like tip burn, along with giving plants a smoother transition into nighttime metabolism.
It’s a fair question: doesn’t dimming the lights for the first and last hour of the day cost you total light? The honest answer is yes, unless you compensate for it. Because the lights aren’t running at full intensity during the ramp periods, you lose some accumulated photons compared to a straight on/off schedule of the same length. To hit the same target DLI, you need to raise your peak midday intensity slightly to make up for what’s lost during the ramps. The calculator at the bottom of this page does that math for you.
There’s a reasonable physiological argument that a gradual wake-up helps prevent tip burn in leafy greens. Tip burn is fundamentally a localized calcium deficiency in fast-growing tissue, caused by uneven transpiration. If a sudden blast of light causes outer leaves to transpire aggressively before root pressure has had time to stabilize, that can pull water and mobile calcium away from more delicate inner leaves before they’ve had a chance to draw their own share. A gradual ramp gives root pressure and transpiration more time to synchronize, which plausibly distributes calcium more evenly. This is a physiologically sound argument based on how calcium transport works, though it’s worth being clear that the specific claim needs your own before-and-after observation to confirm on your particular crop and setup, rather than treating it as a guaranteed outcome.
The dusk side matters too. As light levels drop, plants shift into different metabolic gears, including processes tied to moving stored carbohydrates around the plant overnight. A gradual sunset gives the plant a longer window to make that transition smoothly rather than getting cut off mid-process by sudden darkness.
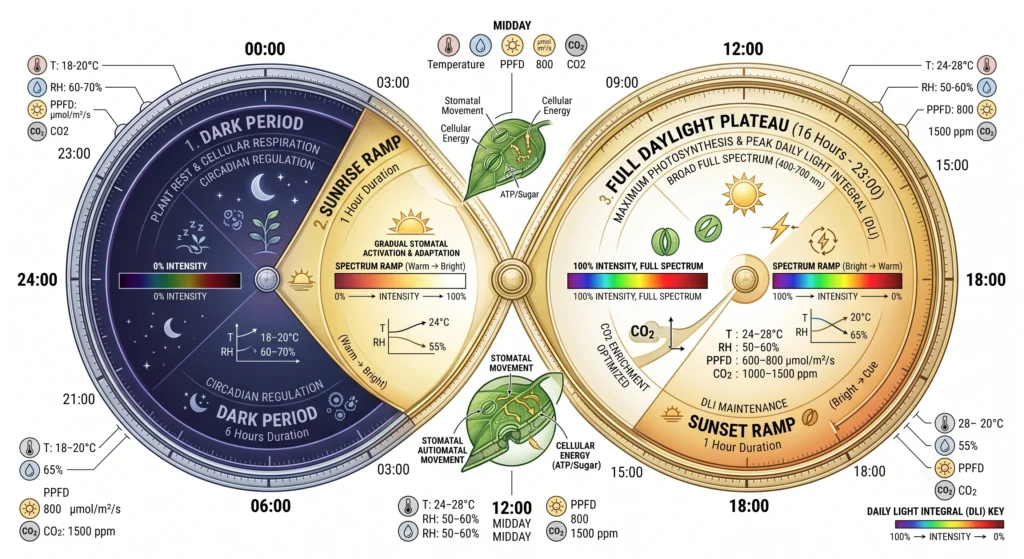
On energy, the math is straightforward and not really up for debate: a 60-minute total ramp time (30 minutes dawn, 30 minutes dusk, or similar) means roughly an hour less of full-power draw per fixture per day compared to running at 100% the entire scheduled period, aside from whatever compensation boost you add at peak. Scaled across a commercial facility running for a full year, that’s a real, calculable energy difference. Pair this with solid nutrient practice from our hydroponic pH and EC mastery guide for the full picture.
Industry Implications for LED Controller Dimming
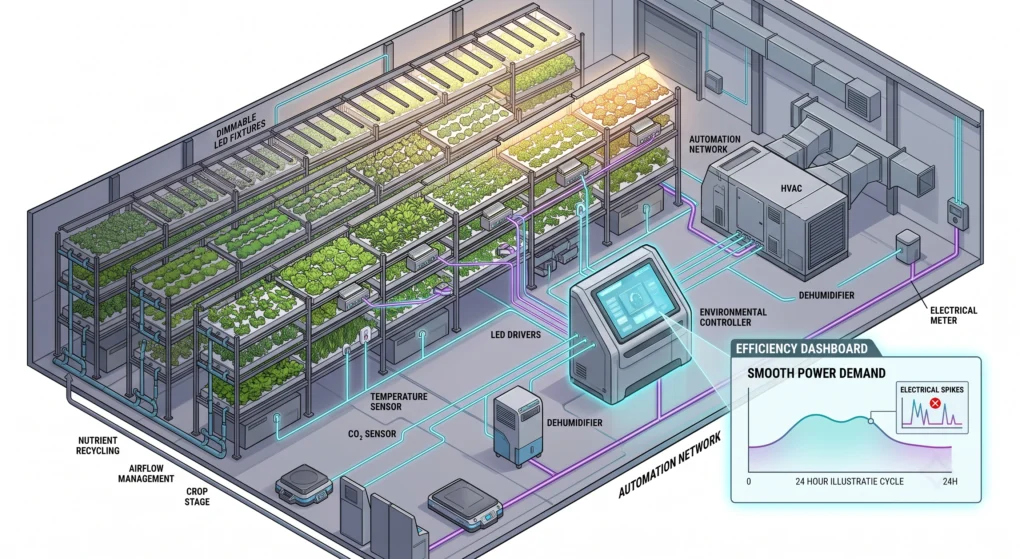
Wider use of 0-10V analog and PWM digital led controller dimming has shifted a lot of environmental control from reactive to proactive. Commercial vertical farms use these curves for plant physiology reasons, but also to avoid the kind of sharp electrical demand spikes that trigger expensive peak-demand utility charges.
When a large commercial facility running thousands of high-wattage fixtures flips everything on at once, the electrical grid sees a genuinely large, instantaneous draw. That kind of spike is exactly what triggers peak-demand utility charges, where commercial customers get billed based on their single highest 15-minute draw for the entire billing period, not just their average usage. A ramped startup acts as a soft-start for the whole facility’s electrical draw, which is a real, quantifiable cost lever independent of anything happening at the plant level.
The thermal side benefits too. Lights snapping on at full power creates an instant heat load spike in the room, forcing HVAC and dehumidifiers to react rather than track smoothly. That reactive scramble tends to create a rocky first hour or two of temperature and humidity swings before things settle. A gradual dimming curve lets HVAC systems track the rising heat load in something closer to real time, which is easier on the equipment and easier on VPD stability. Pairing this with the gear covered in our affordable hydroponic controllers breakdown gives you the hardware to actually execute this.
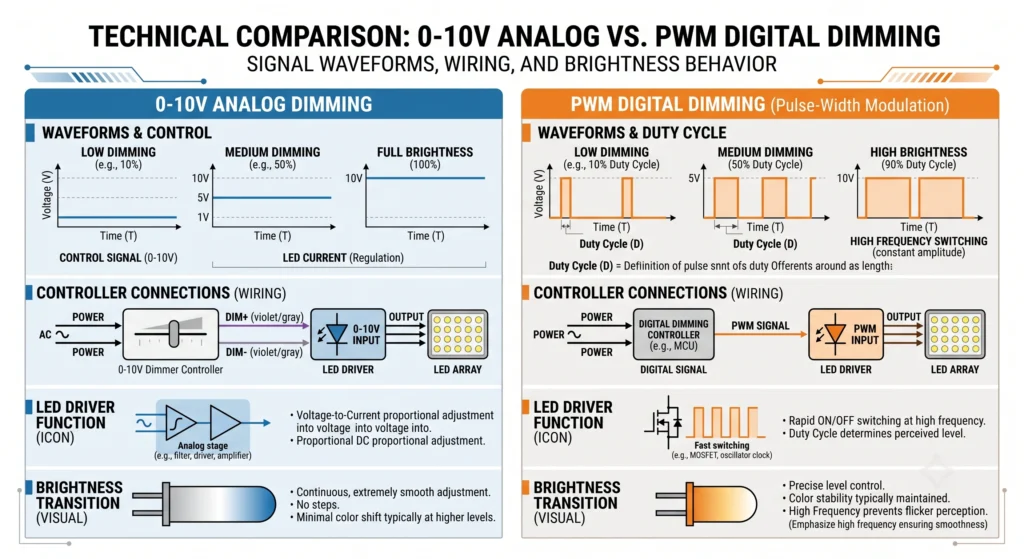
There are two main protocols used for this kind of dimming:
- 0-10V analog dimming. The industry standard. A low-voltage signal tells the driver what percentage of power to output, 10V for 100%, 5V for roughly 50%, and so on. Reliable over long cable runs.
- PWM (pulse width modulation). A digital signal that pulses power on and off rapidly, thousands of times per second, to create the perceived dimming effect. Often gives finer control at very low intensity (the 1 to 10% range) than analog dimming does.
Both protocols work for driving a ramped photoperiod that keeps a crop’s internal clock synced with your facility’s schedule. For measuring the results of your dimming setup accurately, our pH and EC meter showdown covers instrumentation that pairs well with environmental sensor data.
Affiliate Product Suggestions
To actually implement and measure a dimming curve, you need the right hardware. Here’s what’s genuinely useful for this.

The central controller needed for real led controller dimming. Lets you set specific sunrise and sunset durations (commonly 30, 60, or 90 minutes) and works with most major LED brands over standard RJ14 cables and 0-10V protocols.

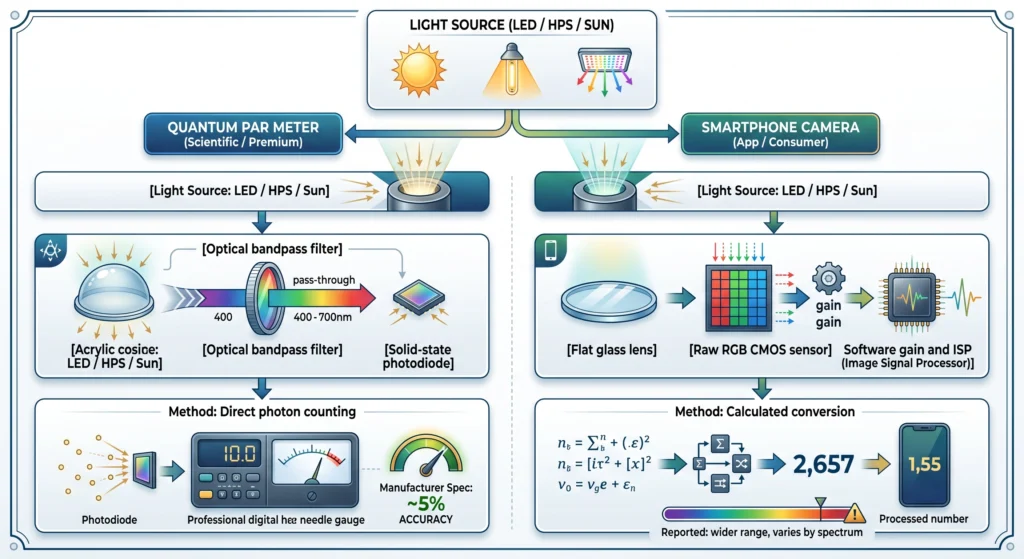
You can’t manage what you can’t measure. Connecting a quantum sensor via USB lets you log actual PPFD minute by minute while a ramp runs, so you can confirm your curve is hitting the intensity targets you designed it for.

Since sunrise and sunset simulation directly affects room climate, this gives real-time graphed VPD, temperature, and humidity data, useful for confirming whether your dimming curve is actually preventing the morning HVAC spike it’s meant to smooth out.

Since sunrise and sunset simulation directly affects room climate, this gives real-time graphed VPD, temperature, and humidity data, useful for confirming whether your dimming curve is actually preventing the morning HVAC spike it’s meant to smooth out.
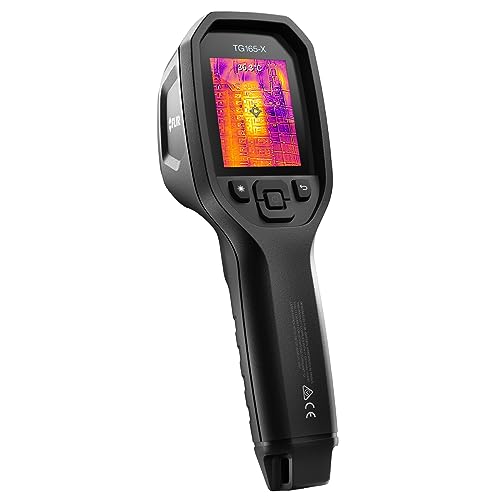
A genuinely useful tool for checking whether your curve is doing what it’s supposed to. Pointing a thermal camera at the canopy during a dawn ramp lets you see directly whether leaf surface temperature is staying stable as intensity climbs, which is a real, visible way to confirm the physiology described above is actually happening in your specific grow.
Frequently Asked Questions
What is a grow light dimming curve?
A programmed lighting schedule where LED intensity increases gradually at the start of the photoperiod and decreases gradually at the end, instead of switching instantly between 0% and 100%.
How long should sunrise sunset simulation grow lights take to ramp up?
Somewhere in the 30 to 60 minute range works well for most crops, and roughly matches the timescale over which stomata actually respond to a light increase based on published research.
Does photoperiod ramping reduce my plant’s Daily Light Integral?
Yes, slightly, unless you compensate. Because the lights aren’t at full intensity during the first and last portion of the day, you accumulate somewhat fewer total photons. To u003ca href=u0022https://mistculture.com/hydroponic-nutrient-schedule-guide/u0022u003ehit the same target u003c/au003eDLI, raise your peak midday intensity to make up the difference, use the calculator below to get the exact number for your setup.
Do I need a special LED driver for led controller dimming?
Yes. Your fixture needs a dimmable driver that accepts either a 0-10V analog signal or a PWM digital signal. Most quality modern LED fixtures include this as standard.
How does plant circadian rhythm in hydroponics benefit from ramping?
Plants track dawn and dusk using internal biological clocks tied to phytochrome and cryptochrome photoreceptors. A gradual lighting shift gives the plant time to transition its metabolic state smoothly rather than getting jolted between two extremes.
Can I use a smart plug to create a dimming curve?
No. A standard smart plug only switches AC power on or off, it can’t create a gradual ramp. You need a dedicated lighting controller wired directly into the dimming leads on the LED driver.
Will dimming my LEDs extend their lifespan?
Generally, yes. Gradually increasing electrical load reduces thermal shock to the diodes and driver, and limits how long the fixture spends at maximum operating temperature each day, both of which tend to slow component degradation over time.
Ramp Curve Visualizer and Peak Compensation Calculator
See what a linear versus S-curve ramp actually looks like, and calculate exactly how much you need to raise your peak intensity to keep your target DLI unchanged after adding a ramp.
Compare a linear ramp against a sigmoidal (S-curve) ramp over your chosen duration.
Adding a ramp reduces total daily photons unless you raise peak intensity to compensate. This calculates the peak PPFD you need to hit the same DLI as a flat, non-ramped schedule.
Educational tool. This calculation applies to both linear and symmetric S-curve ramps, since a symmetric ramp of either shape averages to roughly half its peak intensity over its duration.
Conclusion
Slamming a crop with full intensity light the instant it wakes up isn’t necessary anymore, and the physiology behind why it causes a small daily stress event is genuinely well supported by published research on stomatal lag. Grow light dimming curves and photoperiod ramping aren’t just a nice-to-have aesthetic touch, they’re a practical way to reduce metabolic stress, smooth out VPD swings, and ease the load on your HVAC infrastructure, all without giving up any total light delivered to the crop, as long as you compensate your peak intensity correctly. Whether you’re running one tent or a full commercial facility, how your canopy wakes up and winds down is a real, controllable variable worth dialing in.

Continue Your Learning Journey