Green Light Plant Growth: The Deep Canopy Photobiology Beyond Traditional PAR

Table of Contents
- Deconstructing the Green Light Myth in Hydroponic Agriculture
- Photobiology Mechanics: How Green Light Penetrates Leaf Tissue
- Canopy Photobiology: Green Light Penetration Hydroponics in Action
- Photomorphogenesis and Stomatal Regulation
- Engineering the Ideal LED Grow Light Green Spectrum
- Worked Illustration: What Green-Enriched Lighting Could Look Like in Practice
- Equipment Recommendations for Spectrum and Canopy Management
- Frequently Asked Questions
- Final Synthesis: Integrating Green Photons into Modern CEA Facilities
- Try It Yourself: DLI & Spectrum Tools
For decades, the indoor growing community operated under a real misconception. Early hobby and commercial setups were a sea of purple, the logic being that plants look green because they reflect green light, so why waste electricity generating a spectrum the plant just bounces back?
That logic birthed the “blurple” era of grow lights, targeting the absolute peaks of chlorophyll a and b absorption with intense red and blue diodes. It turns out the reasoning had a real flaw.
Leaves reflect more green light than red or blue, but they still absorb the majority of it. Research puts whole-leaf green absorption in the 50-90% range depending on species and leaf structure. More importantly, because green light isn’t immediately soaked up by the top layer of chloroplasts, it penetrates deeper into the leaf and pushes further into the lower canopy than red or blue light does. If you’re optimizing an indoor farm, whether commercial vertical farming towers or a small basement setup. The photobiology of the par spectrum green band is one of the bigger yield levers most growers still ignore.
Deconstructing the Green Light Myth in Hydroponic Agriculture
Green light plays a real role in indoor agriculture by penetrating deeper into dense crop canopies than red or blue wavelengths. Once dismissed as inactive under early PAR models, green light (500 to 600 nm) drives lower canopy photosynthesis under high light intensity and helps regulate several important morphogenic responses. Adding green wavelengths to modern LED fixtures can improve both crop biomass and a grower’s ability to visually spot problems early.
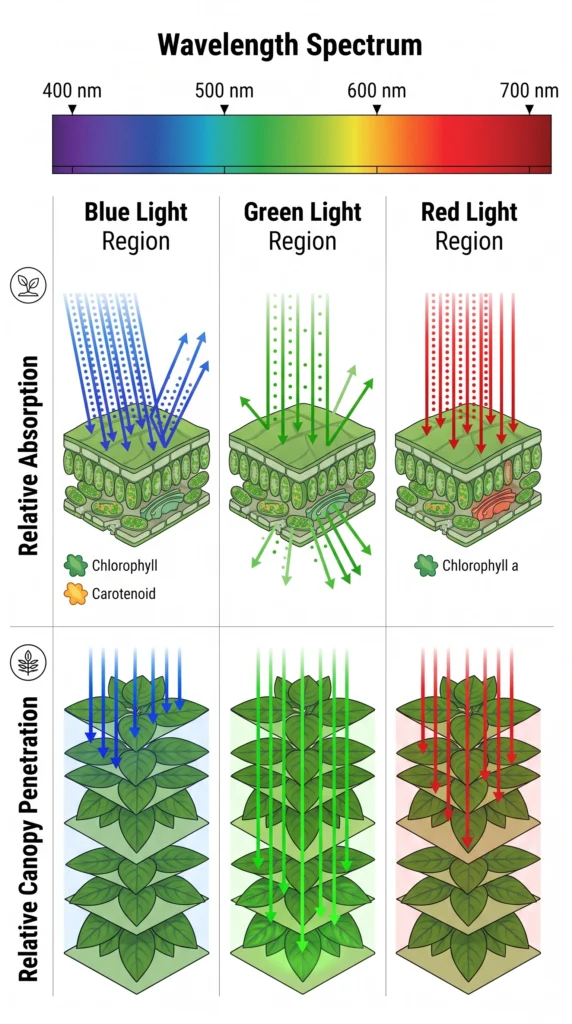
For decades, horticultural lighting operated on a fundamental misconception: that green light is basically useless for plant development. The myth traces back to early measurements of isolated chlorophyll absorption in a test tube. When you extract chlorophyll a and b and shine light through a spectrophotometer, you get dramatic absorption peaks in the blue (430 to 450 nm) and red (640 to 660 nm) bands, with green (500 to 600 nm) mostly reflected or transmitted straight through.
That crude in vitro observation is what pushed early LED manufacturers toward “blurple” grow lights. Supply only red and blue photons, the thinking went, and you get maximum photosynthetic efficiency without wasting energy on green light the plant supposedly doesn’t use.
A living leaf tells a different story. A whole leaf is a layered optical structure made up of epidermis, palisade parenchyma, and spongy mesophyll cells packed with chloroplasts, not a flat slice of pigment in a test tube. When a green photon hits an intact leaf, it isn’t just bounced away. Healthy leaves typically reflect only around 10 to 15% of green light. Another 10 to 15% passes straight through. That leaves somewhere around 70 to 80% of incoming green light absorbed within the leaf itself.
Understanding what happens to that absorbed green light once it’s inside the leaf is changing how growers think about controlled environment agriculture. Pairing this with proper LED distance and PPFD optimization helps make sure every layer of your crop is getting usable light
Photobiology Mechanics: How Green Light Penetrates Leaf Tissue
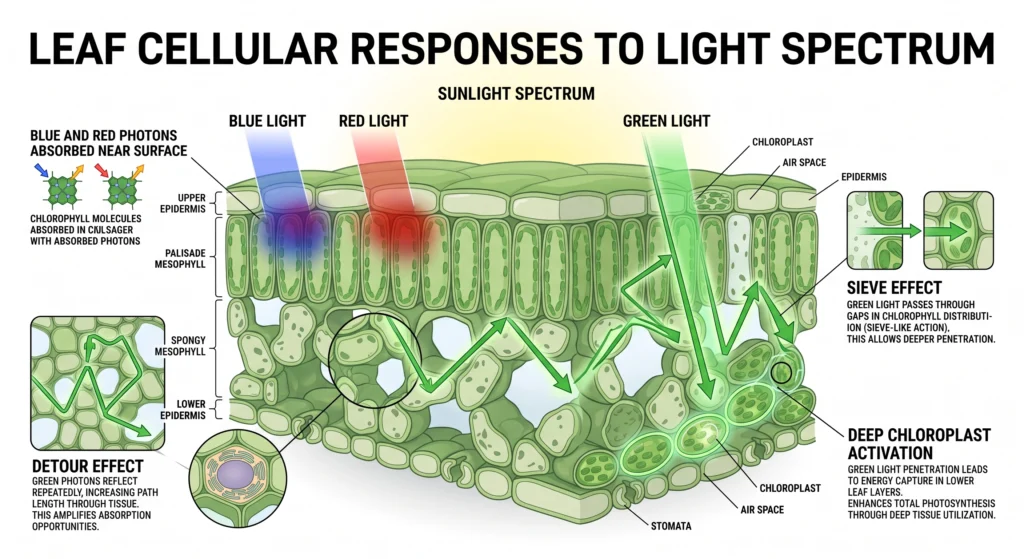
Red and blue photons are absorbed almost entirely in the top layer of the leaf’s palisade mesophyll and hit saturation quickly at high light intensity. Green light has a lower absorption coefficient per unit of leaf thickness, which lets it scatter through the upper layers and reach the spongy mesophyll underneath. That deeper reach is what allows lower leaves to keep contributing real photosynthetic output instead of sitting idle.
The Optics of Leaf Absorption vs Light Scattering
To see why green light matters so much, it helps to look at the physical structure of a leaf. The upper surface consists of the adaxial epidermis, and just beneath it sits the palisade parenchyma, a layer of tightly packed, column-shaped cells rich in chlorophyll. Blue and red light have high absorption coefficients in chlorophyll a and b, so most incident blue and red photons get absorbed within the first fraction of a millimeter of this layer.
Green light behaves differently because it has a lower absorption coefficient per unit of pigment. A green photon can travel further into the leaf before it hits an absorbing molecule. As it moves through the palisade cells and into the irregular, air-filled spaces of the spongy mesophyll, it runs into thousands of tiny cell-water-air boundaries. Each boundary bends and scatters the light in a slightly different direction, a phenomenon researchers call the detour effect.
This scattering can extend the effective path length of green light inside the leaf by a factor of two to four. The longer that path, the more likely a green photon eventually finds a chloroplast in one of the lower cell layers. The leaf essentially traps green light through internal reflection and puts it to work in chloroplasts that blue and red photons rarely reach.
The Quantum Yield Reversal Under High Light
In 2009, plant physiologist Ichiro Terashima and his team at the University of Tokyo published a study in Plant and Cell Physiology that challenged a lot of the older assumptions about lighting design. They measured photosynthetic quantum yield (moles of CO2 fixed per mole of absorbed photons) for leaves exposed to monochromatic red, blue, and green light under a range of background light intensities.
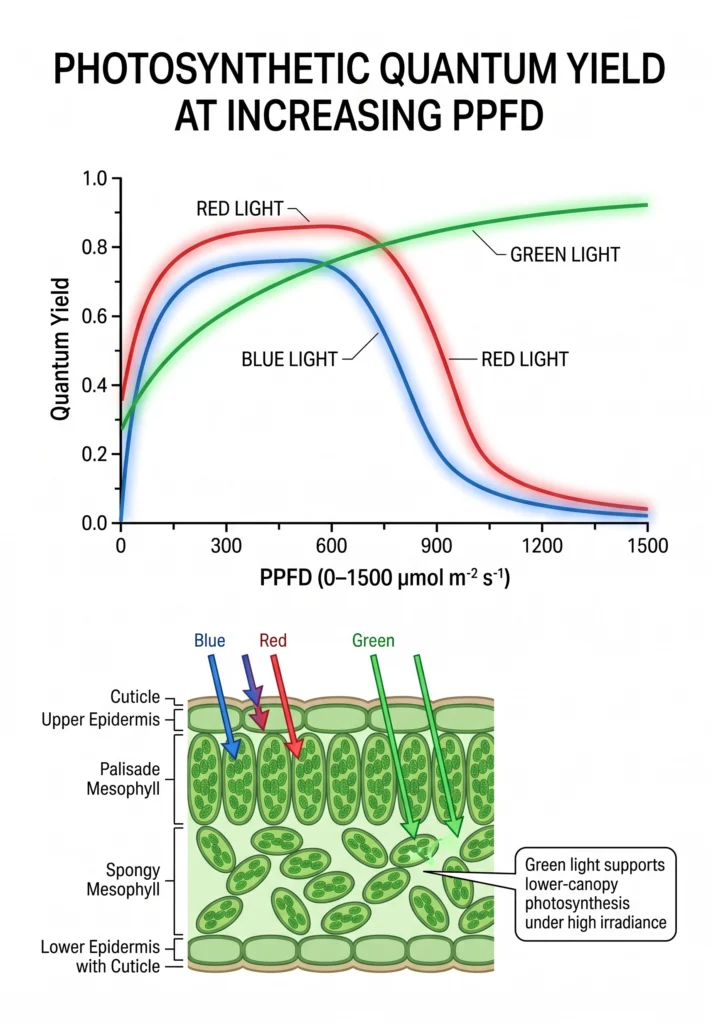
Under low light (PPFD below roughly 200 µmol/m²/s), red light showed the highest photosynthetic quantum yield, blue was close behind, and green trailed both. That makes sense: the upper palisade layer isn’t saturated yet, so red and blue’s high absorption coefficient is doing useful work.
Once background light intensity climbs to the kind of levels commercial growers actually run (roughly 800 to 1,200 µmol/m²/s or higher), the picture changes:
- Chloroplasts in the upper palisade layer become saturated with red and blue light.
- Any additional red or blue photons hitting those upper cells can’t be processed by the photosystem reaction centers (PSII and PSI), so the plant dumps the excess as heat through a protective pathway called Non-Photochemical Quenching (NPQ).
- Green photons skip past those already-saturated upper chloroplasts and reach the still-unsaturated chloroplasts deeper in the spongy mesophyll.
- At high PPFD, green light ends up driving leaf photosynthesis more efficiently than adding more red or blue would.
The practical takeaway for a hydroponic operation is straightforward. Cranking up intensity with red and blue alone runs into diminishing returns because of upper-leaf NPQ losses. Adding a meaningful green fraction routes energy down into lower tissue layers instead, pushing net photosynthetic rate higher without triggering that heat-dissipation ceiling.
Source: Terashima et al., 2009, Plant and Cell Physiology (PubMed)
Canopy Photobiology: Green Light Penetration Hydroponics in Action
Dense hydroponic canopies shade their own lower foliage, sometimes dropping light below the photosynthetic compensation point in the lower layers. Green light helps because it transmits through upper leaves and keeps reaching middle and lower foliage. That vertical redistribution slows leaf senescence, helps maintain a healthy root-to-shoot balance, and lifts overall yield per square meter.
In commercial indoor setups, plants are grown close together to make the most of available floor space. Whether you’re running horizontal Deep Flow Technique (DFT), Nutrient Film Technique (NFT), or vertical aeroponic towers, the canopy closes up fast as the crop matures. Once that happens, the top layer of leaves intercepts nearly all incoming light, and everything underneath goes dim.
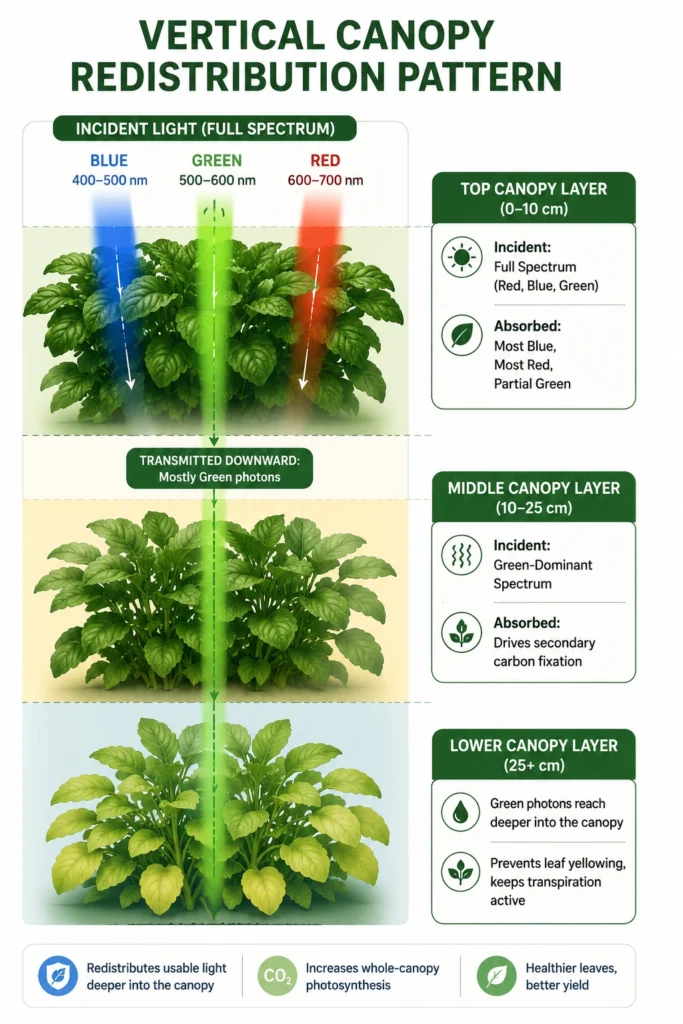
Because the upper leaves absorb red and blue so aggressively, the light that filters down to the middle and lower canopy ends up depleted of red and blue and enriched in green (500 to 600 nm) and far-red (700 to 750 nm) wavelengths. If your fixture doesn’t put out enough green, the light reaching those lower leaves can drop below the light compensation point, the level where photosynthetic carbon fixation just barely equals what the plant loses to respiration.
When lower leaves sit below that compensation point for long enough, two things tend to happen:
- Faster leaf senescence. The plant treats those lower leaves as a drain rather than a source, and pulls mobile nutrients (nitrogen, potassium, magnesium) back out of them, which is why they yellow, wither, and eventually drop.
- A worse canopy microclimate. Dying lower foliage falls into hydroponic channels, clogs drains, and creates the kind of stagnant, humid pockets that invite pathogens like Botrytis cinerea and Pythium.
A grow light with a healthy green fraction changes this picture. Green photons pass through the top leaf layer instead of stopping there. A top leaf acts like a spectral filter: it grabs most of the high-energy blue and red photons for itself, but lets roughly 10 to 15% of the green light through to the leaf just below it. That second leaf absorbs part of what’s left and passes some further down again.
The result is that the plant’s “active photosynthetic volume” expands. Instead of a thin, active top layer sitting over a mostly dark interior, a much larger portion of the plant’s vertical profile is doing real photosynthetic work.
| Light Waveband | Leaf Absorption Rate | Leaf Transmission Rate | Canopy Penetration Depth | Dominant Photosynthetic Zone |
|---|---|---|---|---|
| Blue (400-500 nm) | 90-95% | 1-3% | Top 5 cm (shallow) | Upper palisade mesophyll |
| Green (500-600 nm) | 70-80% | 10-15% | Top 20-35 cm (deep) | Spongy mesophyll and middle canopy |
| Red (600-700 nm) | 85-92% | 2-5% | Top 8-12 cm (moderate) | Upper/mid palisade mesophyll |
| Far-Red (700-750 nm) | 10-20% | 40-50% | Nearly complete pass-through | Stem elongation/shade signaling |
Note: these figures are general ranges drawn from published optical leaf transmittance research, not a specific single dataset. Actual values vary by species, leaf thickness, and canopy density.
Getting canopy assimilation right matters most in high-value vertical setups like vertical farming towers, and it pairs directly with irrigation planning for commercial hydroponic systems for fruits, where fruit weight ultimately comes down to total daily carbohydrate production across both upper and lower leaf layers.
Photomorphogenesis and Stomatal Regulation
Beyond driving photosynthesis, green photons also act as a signal for the plant. A high green-to-blue or green-to-red ratio reads to the plant as canopy shading, which can trigger shade avoidance responses like stem elongation and wider leaf blades. Growers can use these ratios deliberately to shape plant architecture without reaching for chemical growth regulators.
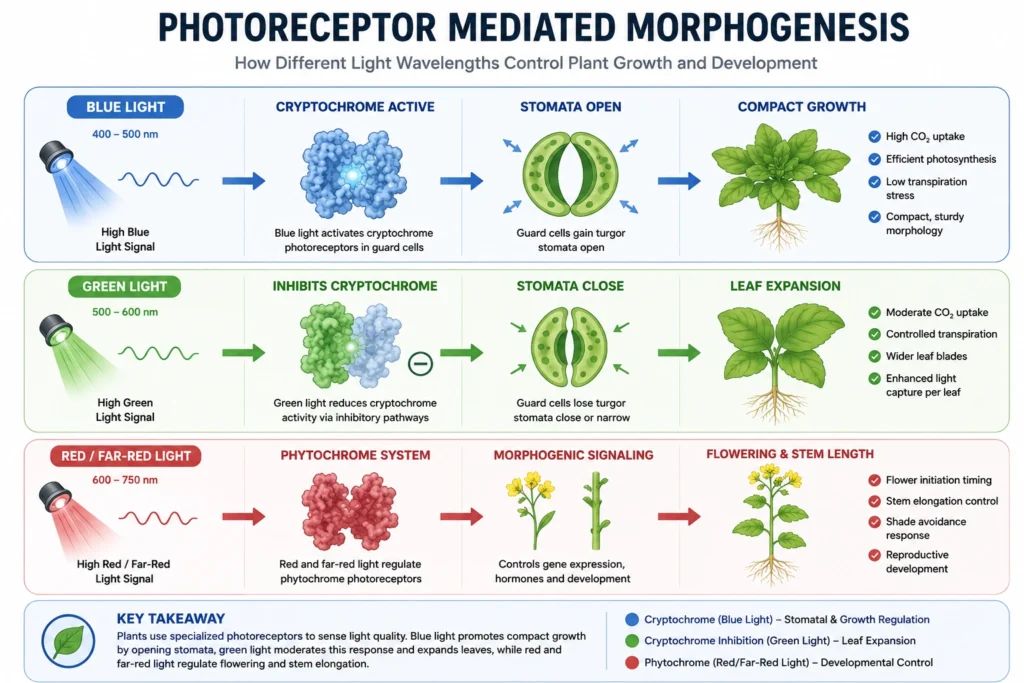
Plants don’t just use light as fuel. They also use it as information: intensity, direction, duration, and spectral makeup all feed into how the plant decides to grow. Green light plays a real part in that decision-making.
Stomatal Conductance and Transpiration Control
Stomata are tiny pores on the underside of leaves that open and close to manage gas exchange, taking in CO2 for photosynthesis while releasing oxygen and water vapor.
Blue light is the main driver behind stomatal opening. When blue photons hit the photoreceptor cryptochrome and the carotenoid zeaxanthin in guard cells, it kicks off a signal cascade that activates proton pumps in the cell membrane. Potassium and chloride ions flow into the guard cells, water follows by osmosis, and the guard cells swell open.
Green light acts as a real, reversible brake on that response. Research by Frechilla and colleagues (Plant and Cell Physiology, 2000) showed that a pulse of green light reverses blue-light-stimulated stomatal opening, and this reversal has since been documented across a range of plant species. Adding green light on top of a blue-light regime converts zeaxanthin back to violaxanthin, which reduces proton-pumping activity in the guard cell membrane. The guard cells lose turgor and the stomatal opening narrows.
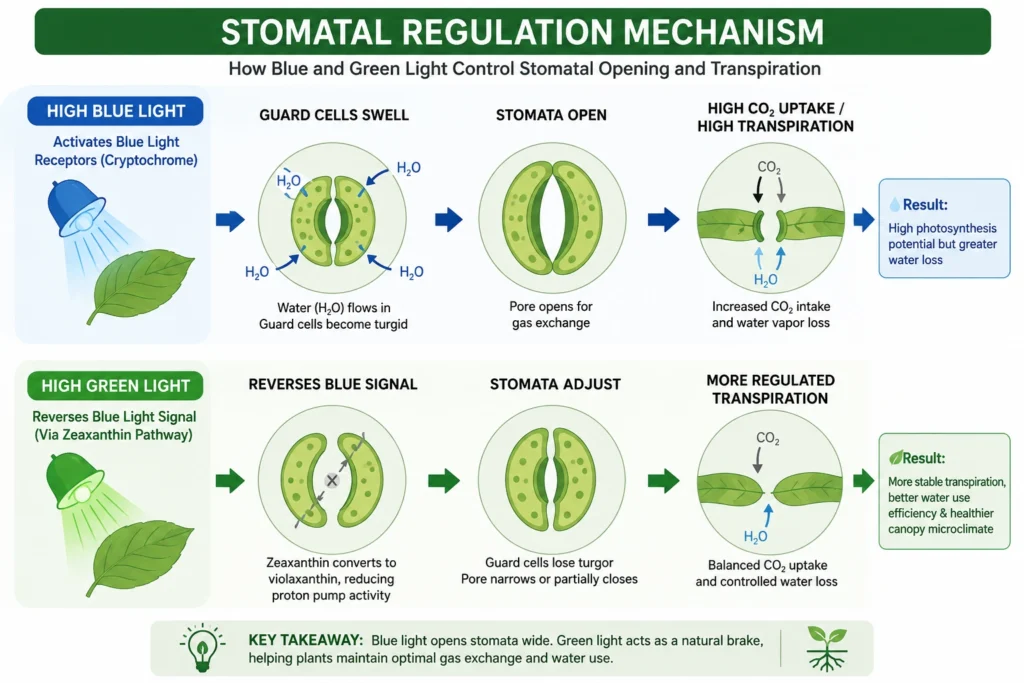
For hydroponic growers, this matters in a practical way. Under pure blue and red LED spectrums, stomata can stay locked wide open, which drives very high transpiration. In a closed grow room with limited airflow, that can push humidity up fast and cause localized saturation right at the leaf surface.
Once relative humidity at the leaf surface hits 100%, transpiration essentially stops. Calcium, which only moves through the plant via the transpiration stream, can’t reach rapidly expanding new tissue anymore. That’s a big part of why calcium deficiency disorders like inner leaf tip burn in lettuce, or blossom end rot in tomatoes, can show up even when the root zone has plenty of calcium available.
Working a 15 to 25% green fraction into your spectrum helps moderate stomatal opening and steady out transpiration, reducing those humidity spikes. Pairing this with the right hydroponic nutrient solution helps keep calcium uptake consistent as your photoperiod and environment shift.
Source: Frechilla, Talbott, Bogomolni & Zeiger, 2000, Plant and Cell Physiology
Shade Avoidance and Canopy Architecture
When plants grow close together, the light passing through neighboring foliage is rich in green and far-red but thin on blue and red. Plants read a high green-to-blue ratio as a sign they’re being shaded out by competitors, and respond with what’s called the shade avoidance syndrome:
- Cryptochrome winds down. A high green-to-blue ratio dampens active cryptochrome signaling.
- Hormones shift. Auxin and gibberellin levels rise.
- Growth shape changes. Petioles stretch, leaf blades get thinner and wider to grab more ambient light, and apical dominance increases.
Growers can lean into this deliberately. Adjusting the green-to-blue ratio in a custom LED array is a real way to shape plant architecture without chemical growth regulators. Want a lettuce head with wider, thinner leaves that fills out a clamshell faster? Push the green-to-blue ratio up. Want a tight, compact structure for a multi-tier rack? Increase blue relative to green to keep the shade avoidance response in check. This matters a lot when you’re working from a grow tent buying guide and vertical headroom is limited.
Engineering the Ideal LED Grow Light Green Spectrum
Most modern full-spectrum LED fixtures use broad-spectrum white diodes, or in some cases dedicated 525 to 530 nm green diodes, to deliver a 10 to 30% green fraction. Swapping a monochromatic “blurple” spectrum for green-infused white light tends to help both photosynthetic efficiency across the canopy and a grower’s ability to catch problems visually.
The lighting industry has largely moved away from narrow-band monochromatic fixtures toward broad-spectrum white LED arrays. These are typically built by pairing blue LED chips (around 450 nm) with a phosphor coating. The blue light excites that phosphor layer, which converts part of the high-energy blue output into a broader emission spanning green, yellow, and red.
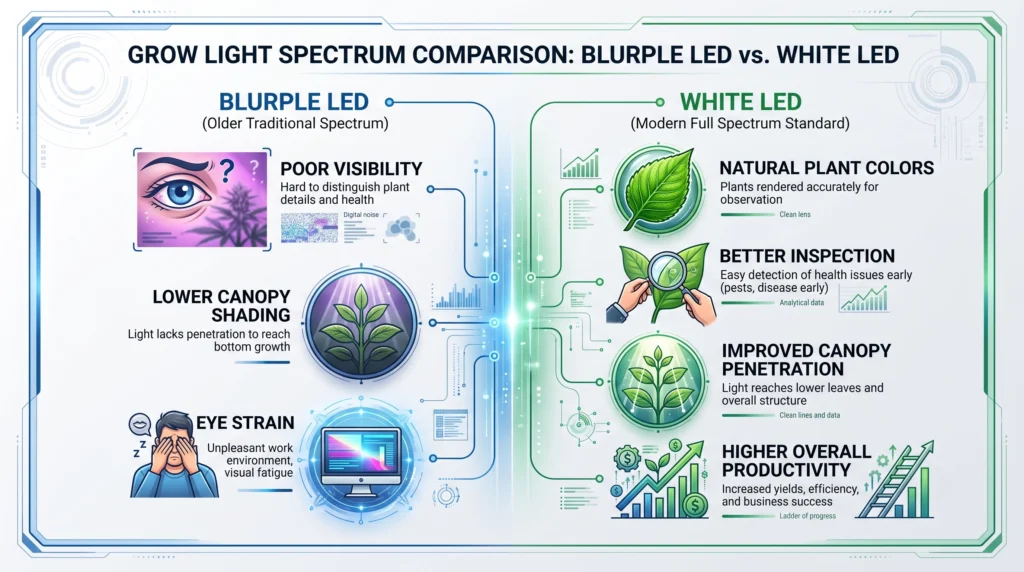
When you’re comparing grow light spectral charts, it’s worth paying close attention to the green fraction (500 to 600 nm) relative to total PAR. Different fixture types trade off differently between efficiency, canopy penetration, and how comfortable they are to work under.
| Light Fixture Type | Spectral Composition (Blue/Green/Red) | Canopy Penetration | Human Visual Comfort (CRI) | Photosynthetic Photon Efficacy | Best Use |
|---|---|---|---|---|---|
| Monochromatic (Blurple) | 20% Blue / 0% Green / 80% Red | Low, top-heavy | Very poor (under 20 CRI) | 1.8 to 2.2 µmol/J | Seedling propagation only |
| Broad-Spectrum Cool White (5000K) | 30% Blue / 40% Green / 30% Red | Very good | Excellent (85-90 CRI) | 2.3 to 2.6 µmol/J | Vegetative growth, leafy greens |
| Broad-Spectrum Warm White (3000K) | 12% Blue / 30% Green / 58% Red | Good | Excellent (80-85 CRI) | 2.6 to 3.1 µmol/J | Full-cycle flowering and fruiting |
| Balanced Daylight Mix (4000K + 660nm Red) | 18% Blue / 22% Green / 60% Red | Good, balanced | Very good (85 CRI) | 2.8 to 3.3 µmol/J | Commercial indoor and greenhouse top lighting |
These figures are typical manufacturer-published ranges for each fixture category, not measurements from a single specific product. Always check the manufacturer’s own spec sheet before buying.
The Visual Health Diagnostic Advantage
One benefit of green-inclusive LED spectrums that’s easy to overlook is simple human visibility. Under monochromatic blurple light, the human eye can’t perceive natural plant color at all. Everything looks dark purple or nearly black.
That makes it genuinely hard to catch:
- Interveinal chlorosis. Early iron or magnesium deficiency shows up as subtle yellowing between leaf veins, which is basically invisible under red/blue light.
- Pest infestations. Early populations of spider mites, thrips, or aphids are easy to miss under monochrome lighting.
- Fungal issues. Powdery mildew’s faint white dusting blends right into a high-contrast purple background.
Broad-spectrum white light with a 20 to 30% green fraction typically hits a CRI above 80, which lets plants look their natural green under the lights. That means you can walk through a grow room and actually catch nutrient deficiencies, root problems, or pest outbreaks weeks before they become a real problem. Pairing this with regular water chemistry checks from our hydroponic pH and EC guide gives you both visual and instrument-based ways to catch issues early.
Worked Illustration: What Green-Enriched Lighting Could Look Like in Practice
To make the physiology above concrete, here’s a worked illustration of how a green-enriched spectrum compares to a red/blue-only spectrum under otherwise identical conditions. This is a model built from the published photobiology above, not a specific trial we ran, and the numbers are illustrative rather than measured data.
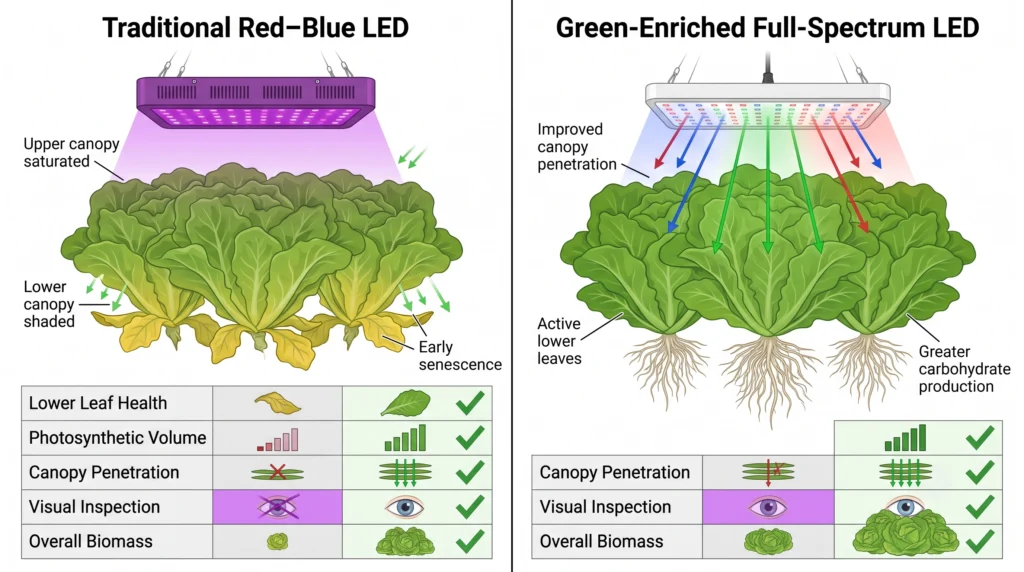
It helps to walk through what this actually looks like on a real crop, even without claiming to have run a formal trial ourselves. Picture two identical, environmentally controlled hydroponic setups growing the same lettuce cultivar side by side.
Illustrative Trial Parameters
If you wanted to actually test this on your own crop, here’s a reasonable framework based on standard hydroponic lettuce trial design:
- Crop: Butterhead lettuce, grown in a recirculating deep water culture (RDWC) system.
- Planting density: Roughly 24 plants per square meter.
- Photoperiod: 16 hours light, 8 hours dark.
- Target Daily Light Integral: Around 46 mol/m²/day at a PPFD of 800 µmol/m²/s measured at top canopy.
- Nutrient solution: A standard modified Hoagland formulation held around 1.8 mS/cm EC and 5.8 pH.
- Environment: Air temperature around 23°C day, 18°C night, relative humidity near 65%, CO2 enrichment around 1,000 ppm if available.
What the Physiology Predicts
- Setup A (0% green, red/blue only): Based on the mechanics described earlier, expect strong top growth but visible chlorosis and early senescence in the lower leaves as they fall below the light compensation point, likely showing up within a few weeks.
- Setup B (roughly 20% green, broad-spectrum white plus deep red): Expect the lower leaves to stay noticeably greener and more active for longer, since they’re still receiving usable green photons the setup A canopy would have blocked out.
Given what the underlying research shows about canopy-level quantum yield and light compensation points, a reasonable expectation is a meaningful gain in total dry biomass for Setup B, likely somewhere in the high single digits to low double digit percentage range, along with better root development from the extra carbohydrate export lower leaves are able to contribute. Exact numbers will depend heavily on your specific cultivar, fixture, and environment, which is exactly why running this as a real side by side test in your own grow room is worth doing before you commit to a full retrofit.
If you do decide to run this yourself, the biggest practical difference to watch for is how long your lower canopy stays green and productive rather than yellowing off early. That single visual signal tracks closely with the underlying physiology this whole article is built on, and it’s something you can check with your own eyes without needing a lab.
Pairing lighting strategy with irrigation planning matters here too, particularly for high value setups like vertical farming towers or commercial hydroponic systems for fruits, where total fruit weight tracks closely with how much of the plant’s leaf area is actually contributing carbohydrates rather than sitting in the shade.
Equipment Recommendations for Spectrum and Canopy Management
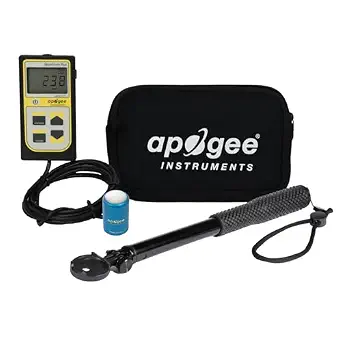
Apogee Instruments MQ-500 Full-Spectrum Quantum PAR Meter
Why I use it: Accurately measures the full 400-700nm range regardless of spectral output, budget light meters commonly under-report green and red. Useful for mapping canopy depth, dropping the sensor into lower branches to check how much light is actually reaching them.
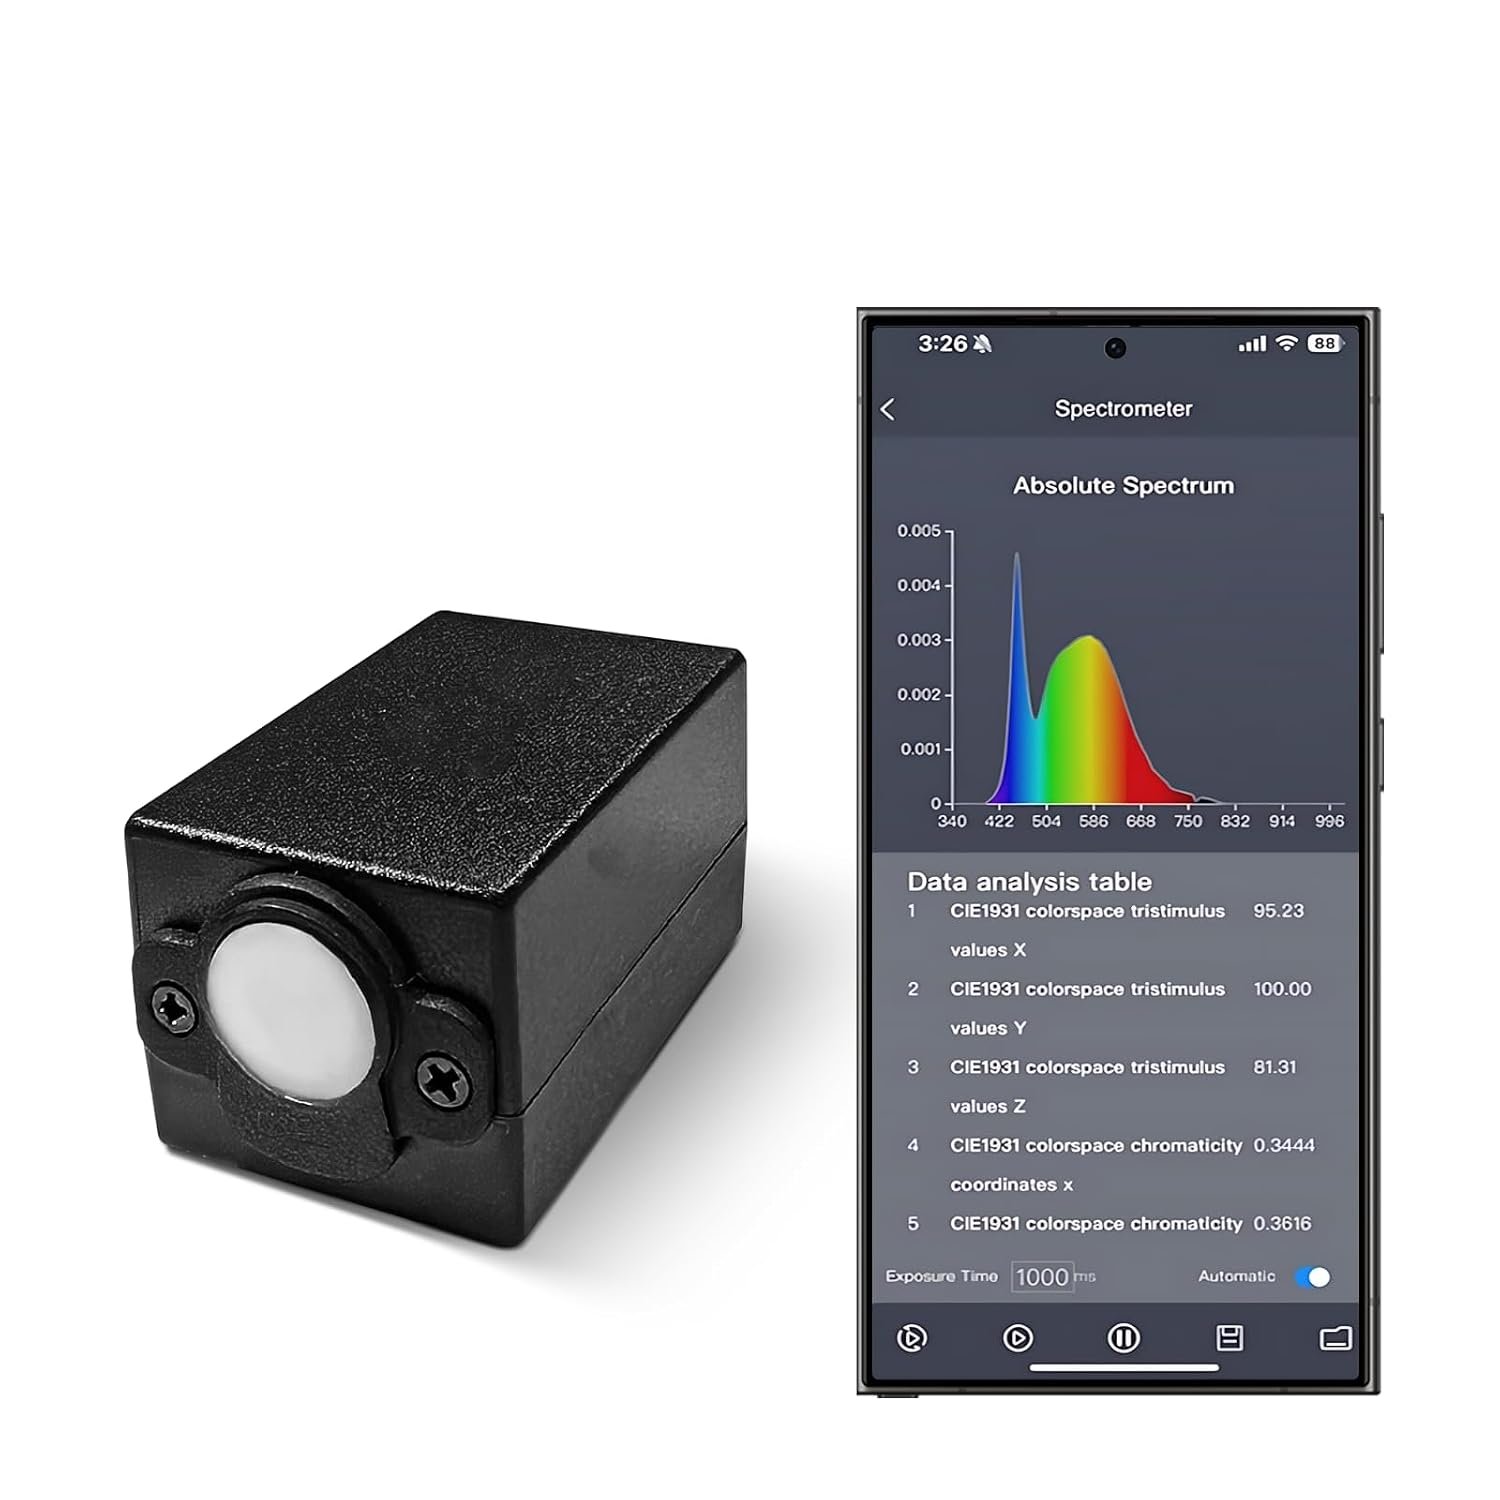
Handheld Spectrometer
Why I use it: A PAR meter tells you how much light you have; a spectrometer tells you what kind. Useful for checking what percentage of a fixture’s output falls in the 500-600nm green band when comparing manufacturers.
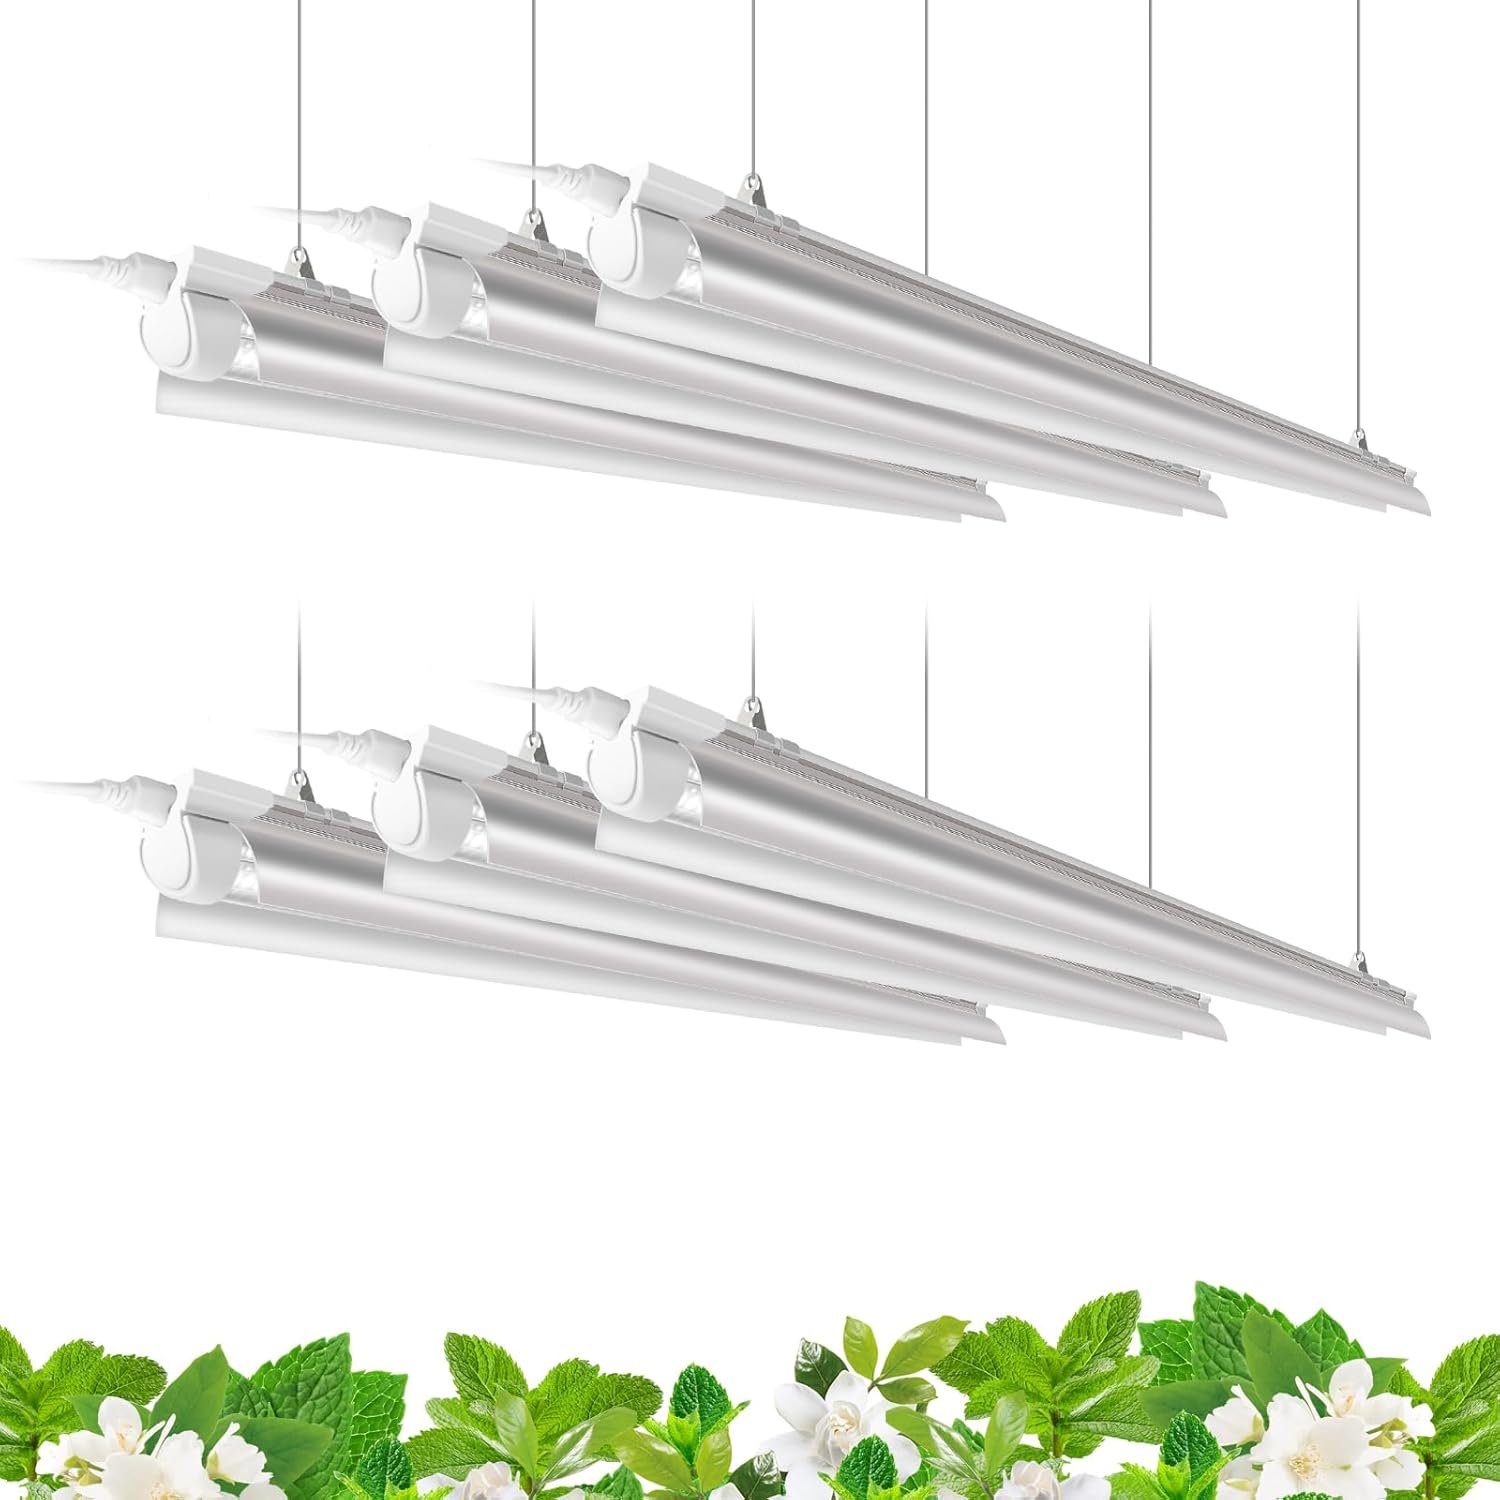
Full-Spectrum White LED Fixture
Why I use it: Quantum-board fixtures using white-light diodes deliver the green-photon-rich output this article covers, typically supplemented with extra deep red for flowering.
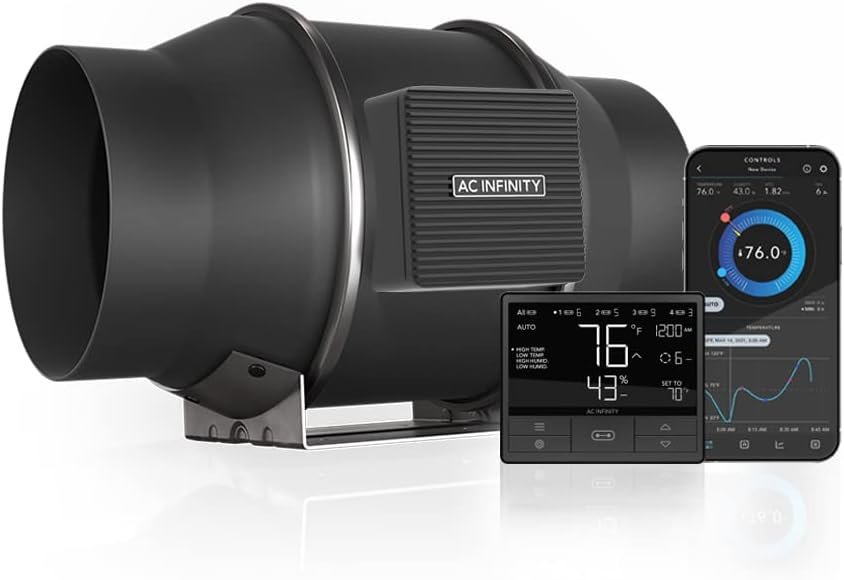
AC Infinity CLOUDLINE T6 Inline Duct Fan
Why I use it: Proper canopy penetration requires managing the boundary layer microclimate. The CLOUDLINE T6 features a variable-speed EC motor controlled by a smart thermal/humidity sensor array.
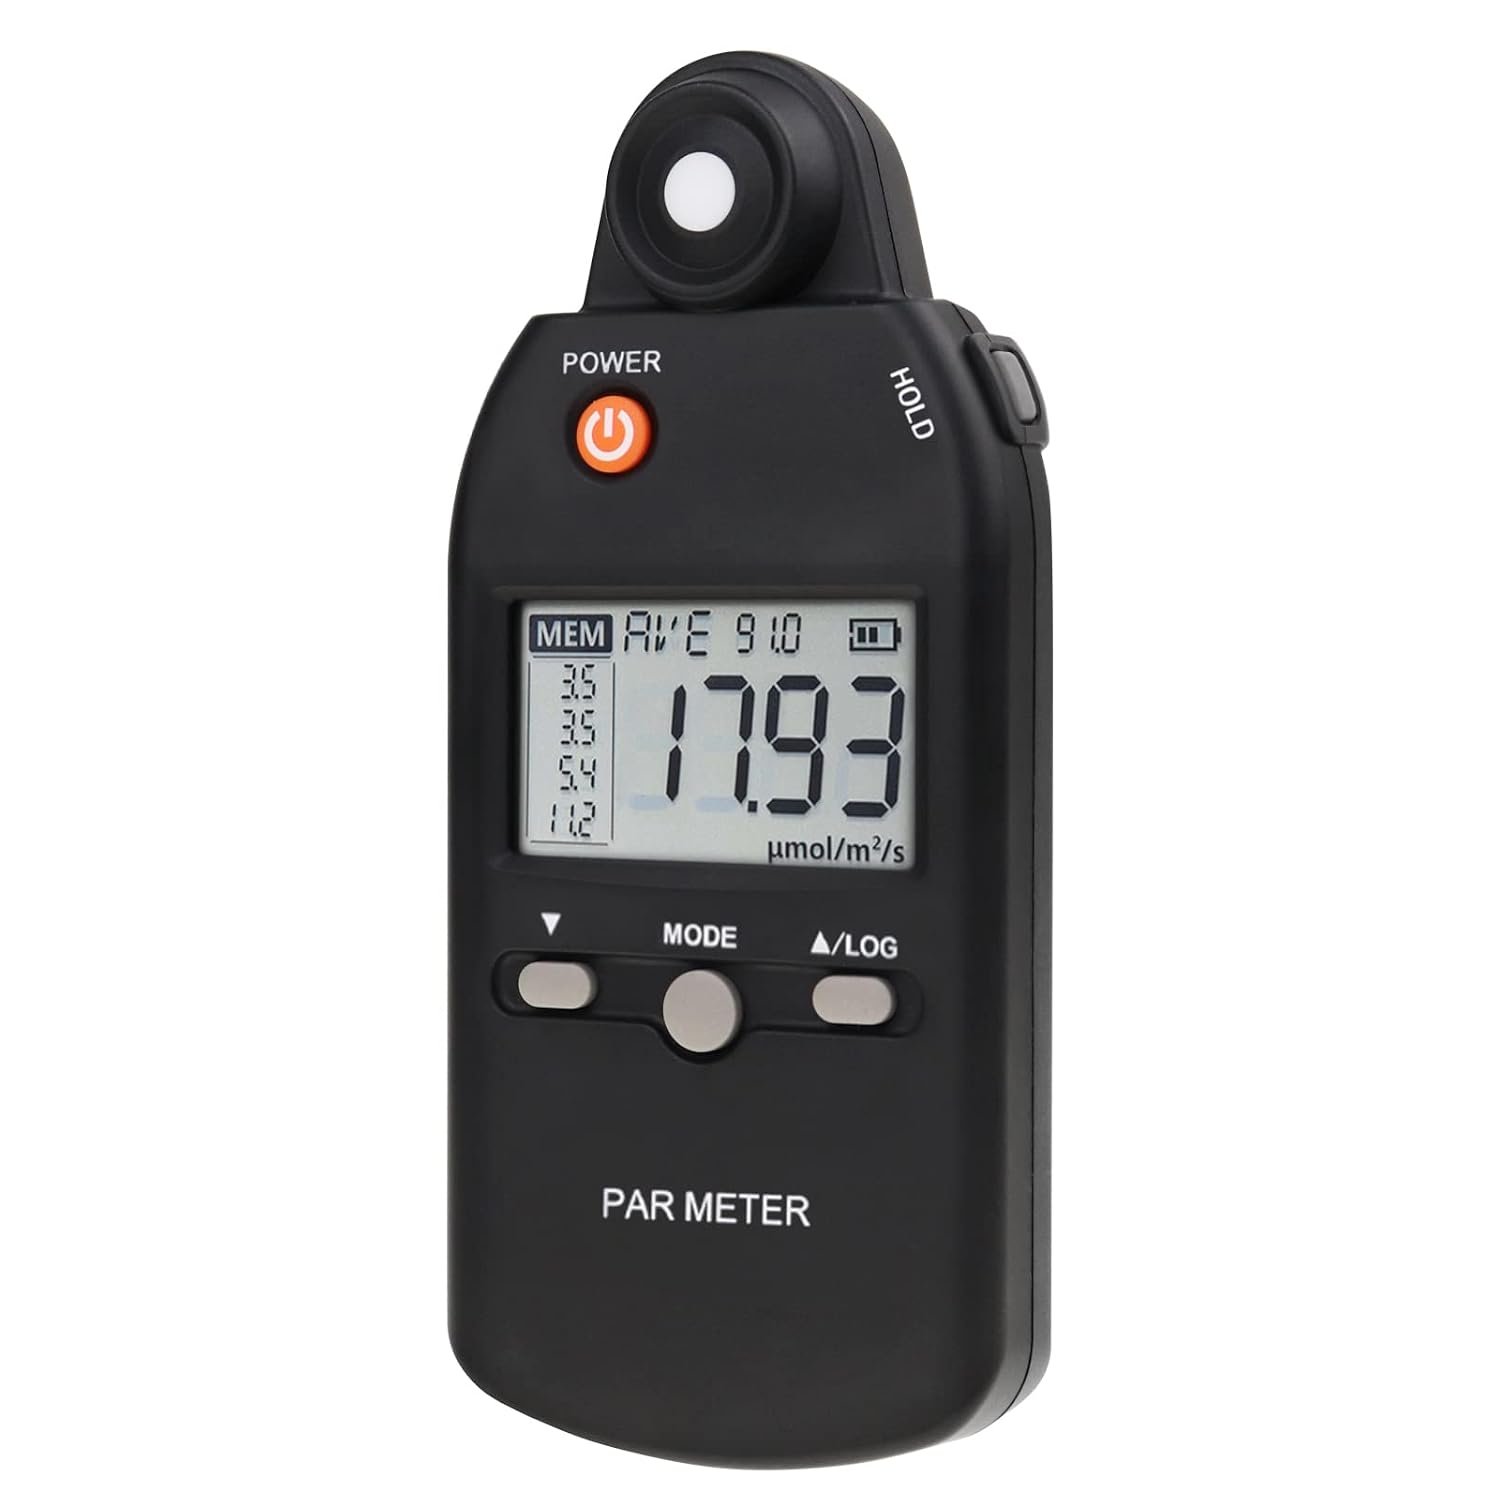
Budget PAR Meter
A more affordable alternative to lab-grade meters, still gives usable PPFD readings under modern broad-spectrum LEDs for setting hanging height without guesswork.
Frequently Asked Questions
Why do plants look green if they absorb green light?
Plants reflect more green light than red or blue, but they still absorb the majority of it, research generally puts whole-leaf absorption in the 50-90% range. Human eyes are highly sensitive to green, so even a modest reflected fraction makes plants look vividly green to us.
Do I need a specific u0022greenu0022 LED to get green light?
No. Modern full-spectrum white LEDs (using diodes like the Samsung LM301B/H series) emit a continuous spectrum that naturally includes a healthy green component, no dedicated green diode needed.
How does green light affect plant morphology?
Blue light tends to keep growth compact; red light can trigger stretching (shade-avoidance response). Green light plays more of a supporting role, deeper canopy penetration means lower leaves are less starved for light, which is associated with fuller, bushier growth and stronger secondary branching in grower reports and some research.
If red and blue are the most efficient at low light, why not just use them at lower intensity?
That works for a thin layer of algae in water, not a three-dimensional plant canopy. Lower the intensity and you undersupply the whole plant; raise it and you saturate the top leaves while wasting the excess as heat. Green light is one of the more efficient ways to get usable energy to leaves lower in the canopy.
Can I measure green light with a cheap lux meter?
Not usefully for growing. Lux meters are calibrated to human vision, which peaks in green, so they over-represent green and under-represent red and blue relative to actual photosynthetic usefulness. Use a dedicated quantum PAR meter (measuring PPFD) instead.
Final Synthesis: Integrating Green Photons into Modern CEA Facilities
The era of monochromatic blurple lighting in controlled environment agriculture is fading out, and for good reason. Green light isn’t some lucky bonus wavelength; it’s a real, functional part of how plants use light.
Green photons drive carbon fixation deeper in the canopy, help regulate transpiration through their effect on stomata, slow down lower leaf senescence, and give growers the visual clarity to catch problems before they become crop-threatening. Choosing a broad-spectrum white LED fixture that supplies somewhere around 15 to 30% green light is a genuinely practical way to get more usable biomass out of the same energy input.
Swap in your real hub page URL and confirm which of the two green light posts you’re keeping live before linking to it here, per the note at the top of this document.
Try It Yourself: DLI & Spectrum Tools
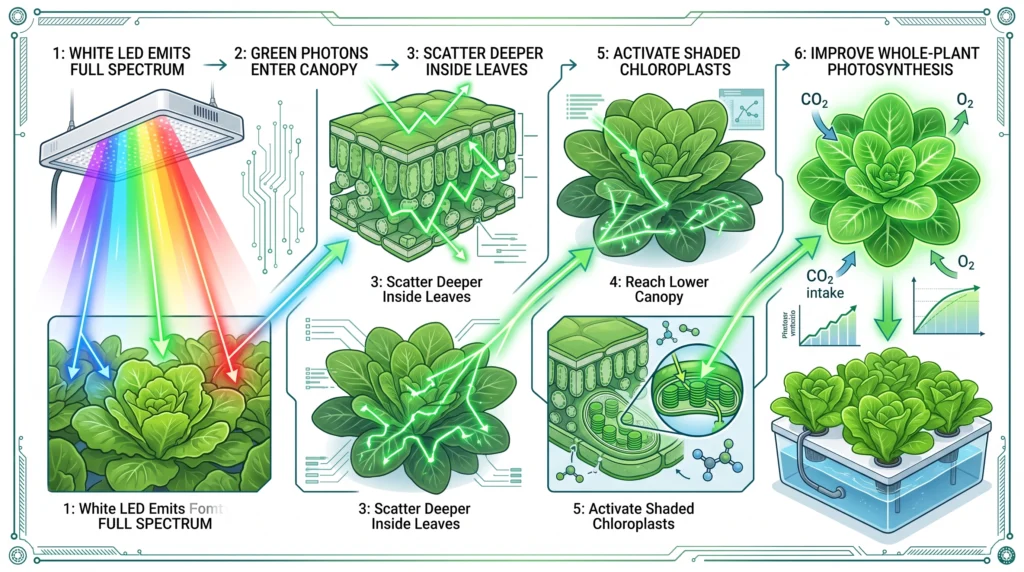
The tools below help you translate this into your own setup. Check whether your current fixture and hang height are actually delivering enough total light, and see how the McCree-curve efficiency pattern looks across the spectrum.
Daily Light Integral (DLI) is the total amount of usable light your canopy receives in a day. Enter your PAR meter’s PPFD reading and your photoperiod to calculate it.
| Crop Stage | Typical Target DLI (mol/m²/day) |
|---|---|
| Seedlings / clones | 10 – 15 |
| Leafy greens / herbs | 12 – 20 |
| Vegetative growth | 25 – 35 |
| Flowering / fruiting (high-light crops) | 35 – 50+ |
Reference ranges only, always check target DLI for your specific crop and cultivar.
Illustrative relative quantum yield across the PAR spectrum, showing the general pattern established by McCree (1972) and refined by later canopy-level research (Terashima et al., 2009). Values are illustrative of the published pattern, not a substitute for a lab spectroradiometer reading of a specific fixture.
Wavelength (nm) Relative Quantum Yield Blue 400-500nm Green 500-600nm Red 600-700nm Low PPFD (~200 µmol) High PPFD (~1000 µmol)Note the gap between red and green narrows, and green can pull ahead, as intensity rises, consistent with the studies cited in the article above.
Educational tools. Always verify against your own PAR meter and spectrometer readings for your specific fixture.
Unlock Deep Canopy Photosynthesis & Spectrum Precision
Green light penetrates deeper into dense crop canopies than red or blue wavelengths, driving lower-leaf photosynthesis. Optimize your DLI, balance spectrum ratios, and calculate exact lighting metrics with our free interactive grower tools.
⚡ 100% Free interactive calculators • Grounded in peer-reviewed horticultural photobiology

Continue Your Learning Journey