Pulse Pro Environmental Monitor Review: Precision VPD, Light, and CO2 Tracking

Table of Contents
- The Engineering Mechanics of the Pulse Pro Monitor
- Calculating and Managing VPD Using the Pulse Pro
- PPFD and DLI: Maximizing Photosynthetic Efficiency
- CO2 Tracking and Enrichment Dynamics
- System Integration and Data Logging Architecture
- Real-World Applications: Commercial Facilities vs. DIY Tents
- Installation, Calibration, and Troubleshooting Protocols
- Frequently Asked Questions
- Final System Assessment
Disclosure: MistCulture summarizes verified product specs, engineering data, and community feedback. We may earn an affiliate commission if you purchase through our links. Regulations vary by location; this content is for educational purposes only.
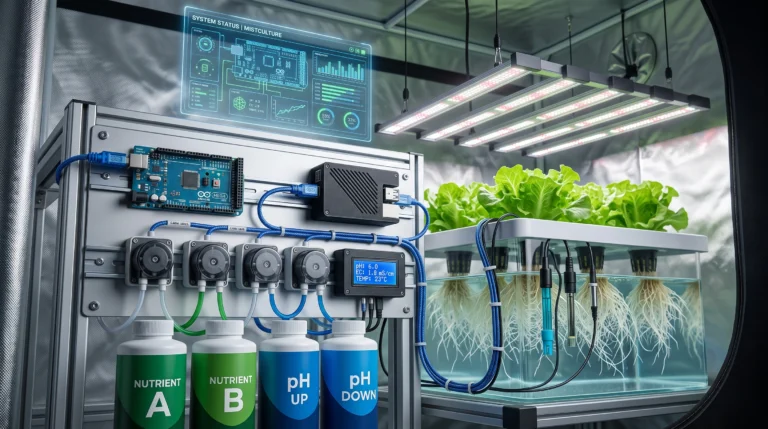
Mastering the climate inside a hydroponic grow space requires continuous, high-resolution data. Basic thermometers and digital hygrometers provide only a surface-level view of ambient conditions, often failing to account for the exact parameters directly driving plant metabolism. The Pulse Pro environmental monitor represents the current state of the art in agricultural data logging, combining multiple highly sensitive sensor arrays into a single, cloud-connected device.
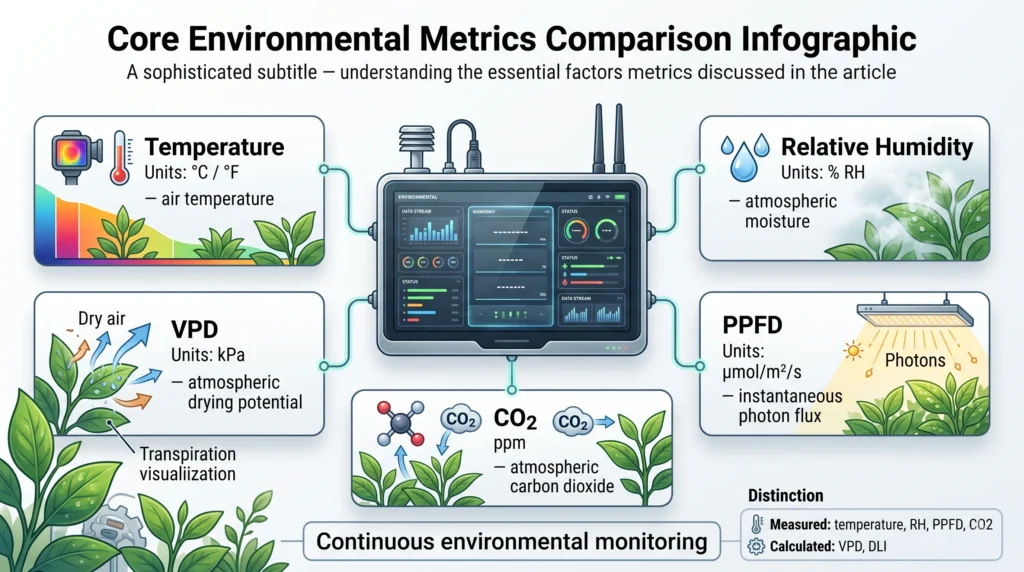
Unlike standard environmental gauges, this unit continuously calculates Vapor Pressure Deficit (VPD) based on real-time leaf temperature estimations, measures Photosynthetic Photon Flux Density (PPFD) using a built-in light spectrometer, and tracks carbon dioxide (CO2) concentrations with a non-dispersive infrared sensor. Agricultural data logging has shifted from manual spot-checks to continuous integration, and the Pulse Pro facilitates this shift by pushing all environmental metrics to a centralized app for long-term trend analysis.
This technical breakdown examines the hardware engineering of the Pulse Pro, walks through the exact mathematical equations it uses to deliver real-time data, and provides detailed guidelines on integrating these metrics into a functioning hydroponic workflow.
The Engineering Mechanics of the Pulse Pro Monitor
Environmental monitoring hardware requires specific sensor types to accurately quantify conditions without succumbing to calibration drift from high humidity or intense light exposure. The Pulse Pro utilizes industrial-grade components to isolate and measure specific atmospheric variables.
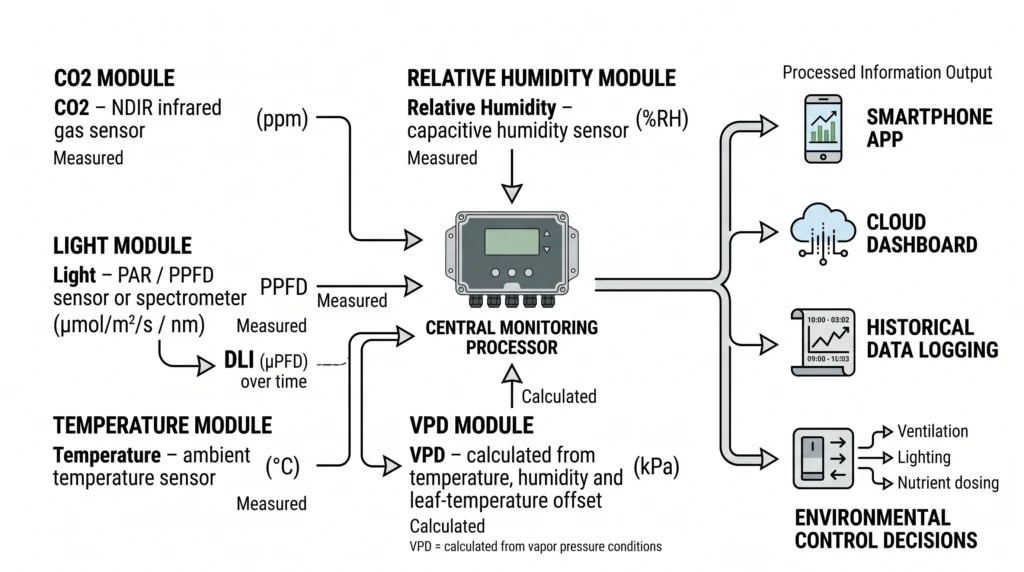
Standard consumer-grade hygrometers experience rapid sensor degradation when subjected to the continuous 60% to 80% relative humidity required in controlled environment agriculture. The Pulse Pro mitigates this degradation by utilizing an integrated sensor suite designed specifically for harsh agricultural conditions.
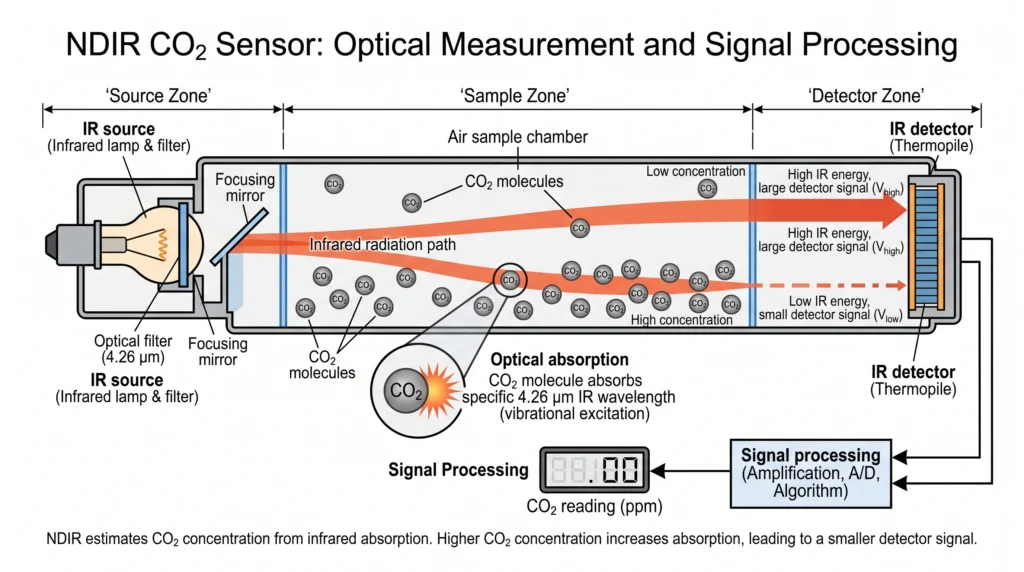
The carbon dioxide levels are monitored using a Non-Dispersive Infrared (NDIR) sensor. An NDIR sensor operates by shining an infrared light through an air sample chamber toward an optical detector. Because CO2 molecules absorb a very specific wavelength of infrared light (typically 4.26 micrometers), the detector can calculate the exact concentration of CO2 based on the amount of light absorbed. This method prevents the cross-contamination readings that plague cheaper electrochemical gas sensors.
For light measurement, the device employs a full-spectrum photospectrometer. Traditional lux meters only measure light intensity weighted toward the human eye’s sensitivity (primarily green and yellow light). The spectrometer in the Pulse Pro captures the specific number of photons falling within the Photosynthetically Active Radiation (PAR) band (400 to 700 nanometers). This ensures that the PPFD readings displayed in the app accurately reflect the actual light energy available for photosynthesis, regardless of whether the light source is a broad-spectrum LED, a high-pressure sodium bulb, or natural sunlight.
To calculate accurate vapor pressure deficits, the unit combines a highly responsive ambient temperature thermistor with a humidity capacitance sensor. The device cross-references this ambient data with plant canopy temperature offsets to compute exact transpiration potential. Evaluating these specific sensor types against other market options requires consulting a comprehensive hydroponic sensors guide to understand the baseline tolerances required for commercial yields.
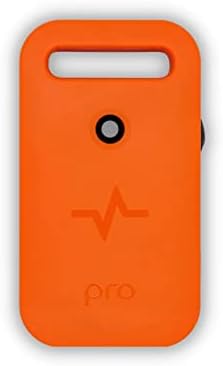
- Boost Yields and Prevent Crop Loss: Remotely track and optimize crop yields by using the ultimate Pulse Pro indoor therm…
- Room Thermometer, Hygrometer, and More: Equipped with several sensors that provide accurate CO2, PAR/PPFD, VPD, temperat…
- Reliable Grow Monitor System: This smart monitor sends instant alerts through unlimited sensors at different locations, …
- Why it’s necessary: Provides continuous, real-time logging of VPD, PPFD, CO2, temperature, and humidity directly to a cloud-based dashboard for precise environmental control.
- Key Spec: NDIR CO2 sensor and full-spectrum PAR spectrometer.
Calculating and Managing VPD Using the Pulse Pro
Vapor Pressure Deficit dictates the transpiration rate of plant leaves. Balancing ambient air temperature, relative humidity, and leaf temperature is required to maintain nutrient transport through the plant’s vascular system.
Relative humidity (RH) is a poor standalone metric for plant health. It only describes how much water vapor the air currently holds compared to its maximum capacity at a given temperature. Vapor Pressure Deficit (VPD), measured in kilopascals (kPa), represents the actual atmospheric pressure pulling moisture out of the plant’s stomata. The Pulse Pro automates this complex calculation, but understanding the underlying math is necessary to interpret the data correctly.
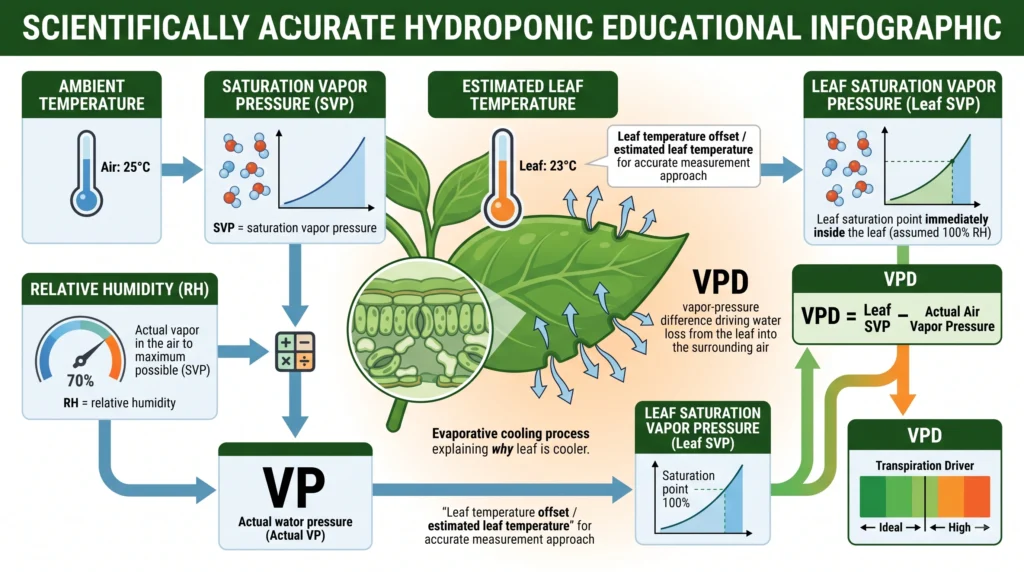
The device calculates VPD using the Tetens formula to find the Saturation Vapor Pressure (SVP). The formula is:
SVP = 0.61078 * exp((17.27 * T) / (T + 237.3))
Where T is the temperature in Celsius.
To calculate the VPD, you must determine the vapor pressure inside the leaf and subtract the actual vapor pressure of the surrounding air. Because plant leaves are constantly evaporating water, they are almost always cooler than the surrounding air. The Pulse Pro allows users to input a leaf temperature offset (typically -1.0C to -3.0C depending on the lighting type) to correct the calculation.
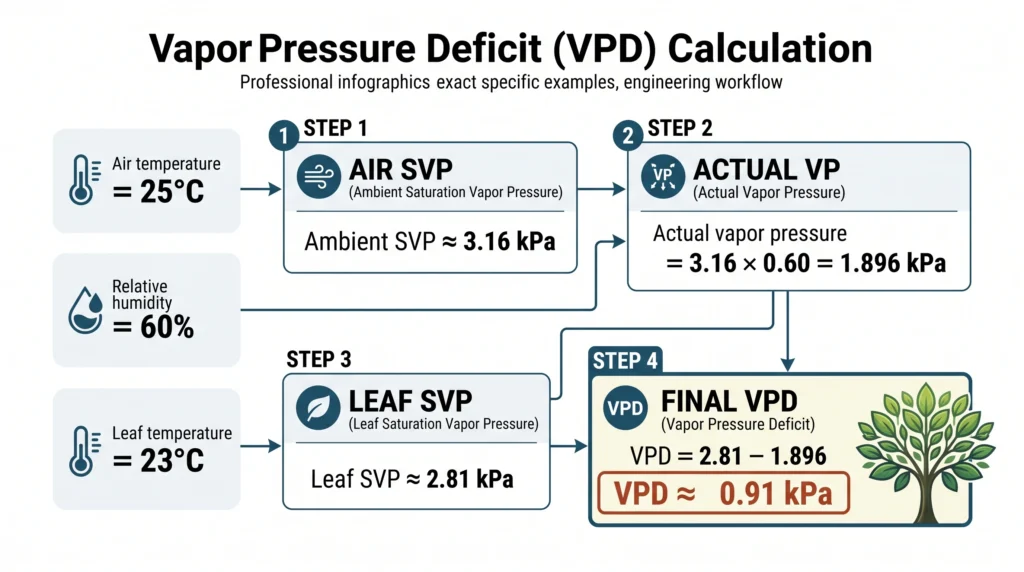
Consider a grow room with an ambient air temperature of 25C (77F) and a relative humidity of 60%.
- The ambient air SVP is calculated as: 0.61078 * exp((17.27 * 25) / (25 + 237.3)) = 3.16 kPa.
- The actual vapor pressure of the room is the ambient SVP multiplied by the humidity percentage: 3.16 * (60 / 100) = 1.896 kPa.
- Assuming a leaf temperature of 23C due to transpiration cooling, the leaf SVP is: 0.61078 * exp((17.27 * 23) / (23 + 237.3)) = 2.81 kPa.
- The true VPD is the leaf SVP minus the actual room vapor pressure: 2.81 kPa – 1.896 kPa = 0.914 kPa.
A VPD of 0.91 kPa is perfect for the late vegetative stage. If the VPD drops too low (below 0.4 kPa), the air is so saturated that the plant cannot evaporate water. Transpiration halts, taking root-level nutrient uptake with it. If the VPD rises too high (above 1.6 kPa), the air is so dry that the plant will close its stomata to prevent complete dehydration, halting photosynthesis entirely.
The automated tracking provided by the Pulse Pro allows growers to adjust their humidifier and exhaust fan thresholds to maintain a stable VPD curve throughout the day. When environmental conditions alter the VPD, the plant’s nutrient and water consumption rates change. Growers must adjust the electrical conductivity of their reservoir to match these environmental shifts. Utilizing a hydroponic nutrient calculator ensures the feed strength remains perfectly aligned with the plant’s current transpiration rate.

- High Accuracy & Dual Channels: Utilizing a built-in smart Swiss sensor, coupled with the option to incorporate an extern…
- User-Friendly Design: Easy to use with a big, clear LCD screen, visualized VPD design, highest and lowest temp & humidit…
- Remote Control & Smart App Alerts: Connect to Vivosun App via Bluetooth to monitor temperature, humidity, and VPD data r…
- Why it’s necessary: Serves as a secondary sensor for multi-zone monitoring, allowing growers to track microclimates in different areas of the facility simultaneously.
- Key Spec: Bluetooth connectivity with targeted VPD curve mapping.
PPFD and DLI: Maximizing Photosynthetic Efficiency
Light acts as the primary metabolic signal for plant development. Tracking the exact density of photosynthetically active photons hitting the canopy ensures the crop receives enough daily energy to reach maximum yield without suffering from light stress.
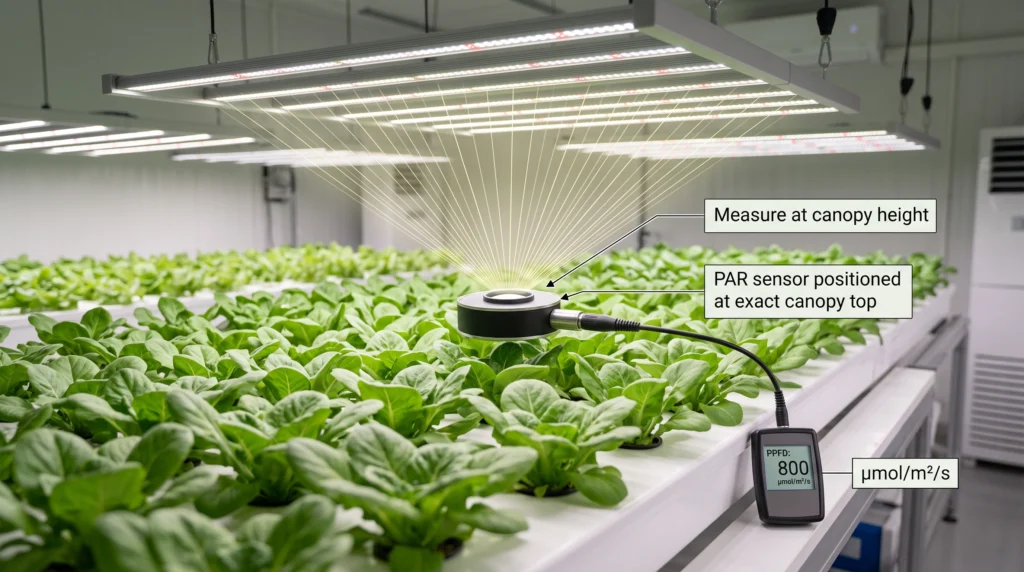
Evaluating light intensity with the naked eye is impossible. Human vision adapts to brightness dynamically, rendering our perception useless for horticultural assessment. The Pulse Pro removes the guesswork by tracking Photosynthetic Photon Flux Density (PPFD). PPFD measures the exact number of photons within the 400nm to 700nm range that fall on one square meter of canopy space per second (μmol/m2/s).
Placing the Pulse Pro directly at canopy level provides a live readout of light intensity. For vegetative growth, targeting 300 to 500 μmol/m2/s is standard. During heavy fruiting or flowering, intensity should be scaled to 800 to 1000 μmol/m2/s. If the light exceeds the plant’s ability to process it, the chloroplasts suffer photobleaching and the leaf tissue degrades. Reviewing a detailed led distance and ppfd guide will help establish the exact hanging height required for your specific lighting fixtures.
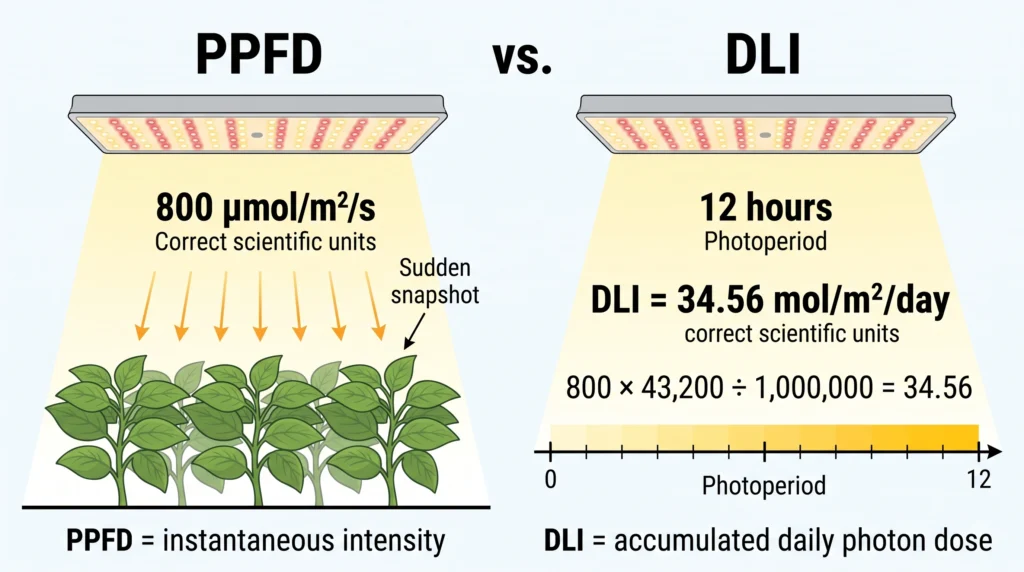
The real power of the Pulse Pro lies in its ability to calculate the Daily Light Integral (DLI). While PPFD measures instantaneous intensity, DLI measures the total accumulation of photons over the entire photoperiod. DLI is expressed in moles per square meter per day (mol/m2/d).
To calculate DLI manually, you multiply the PPFD by the number of seconds the light is on, and divide by one million.
Example: A light providing 800 μmol/m2/s running for 12 hours.
DLI = 800 * (12 hours * 3600 seconds) / 1,000,000
DLI = 800 * 43,200 / 1,000,000 = 34.56 mol/m2/d.
Different crops have strict DLI limits. When growing hydroponic lettuce and spinach, a DLI of 14 to 17 mol/m2/d maximizes growth while preventing premature bolting or tip burn. Fruiting crops require much higher daily integrals, often targeting 30 to 45 mol/m2/d to produce dense tissue and heavy yields. By logging light levels every minute, the Pulse Pro app automatically generates a cumulative DLI score, alerting the grower if the lighting cycle needs to be extended or the fixtures dimmed.
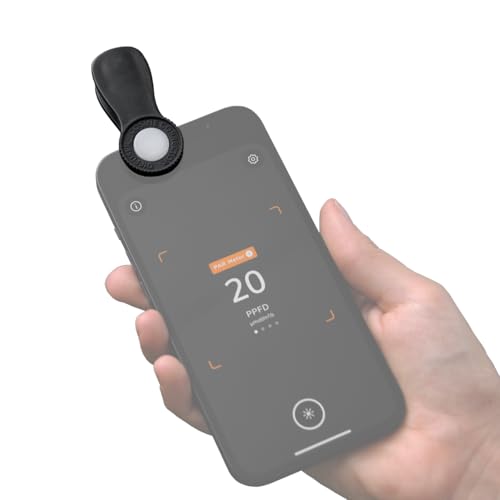
- ✅ Photosynthetically Active Radiation (PAR) as PPFD in μmol/m²/s
- ✅ Daily Light Integral (DLI) in mol/m²/d
- ✅ Illuminance in lux or foot-candles
- Why it’s necessary: Provides spot-checking capabilities for canopy corners and edges to ensure uniform light distribution across the entire footprint.
- Key Spec: Measures full-spectrum PAR up to 3000 μmol/m2/s.
CO2 Tracking and Enrichment Dynamics
Ambient carbon dioxide levels deplete rapidly in sealed growing environments. Precise NDIR monitoring guarantees that atmospheric carbon remains above the threshold required for the Calvin cycle to function efficiently.
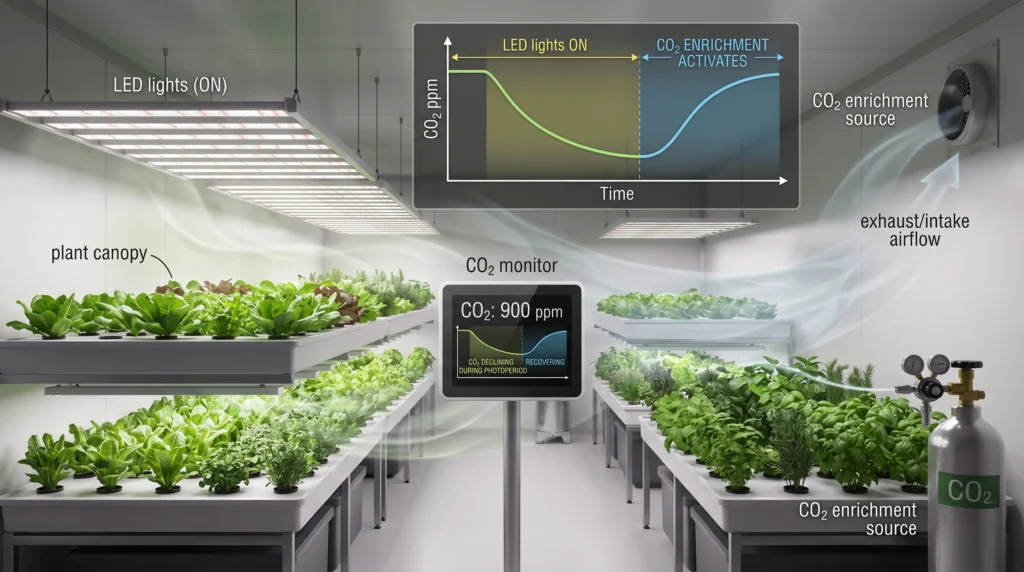
Plants consume massive amounts of carbon dioxide during the photoperiod. In a heavily planted, sealed room, the crop can drop the ambient CO2 concentration from a baseline of 400 parts per million (ppm) down to 200 ppm in less than an hour. Below 250 ppm, the rate of photosynthesis plummets, causing growth to stagnate regardless of how much light or nutrient is available.
The Pulse Pro utilizes an integrated NDIR sensor to track these fluctuations in real time. Growers running exhaust fans rely on this data to ensure their intake air is providing enough fresh CO2 to keep the room near 400 ppm. For high-yield environments, growers inject supplemental CO2 using compressed tanks or natural gas burners to elevate the concentration to 1000-1200 ppm.
Enriching CO2 alters the physical limits of plant growth. When atmospheric carbon is doubled or tripled, the plant can process significantly more light energy. A crop that would normally experience light stress at 800 μmol/m2/s can comfortably process 1200 μmol/m2/s when CO2 levels are maintained at 1200 ppm. Operating these parameters safely requires syncing the data logging with active relay hardware. Comparing different automation units through a best hydroponic controllers under 200 breakdown will reveal options capable of activating exhaust fans if CO2 levels exceed safe human thresholds (typically above 2500 ppm).

- HIGH PRECISION: The CO2 Detector is euipped with high accurate sensative chip, the accuracy of CO2 level is: 0-2000ppm(-…
- Large Measurement: This CO2 Meter is designed with accurate and large measuring range, CO2: 0~9999ppm; Temperature: 14°F…
- AUDIBLE AND VISUAL ALARMS – The CO2 Detector will alarm when CO2 level exceed your desired threshold, enabling you to ta…
- Why it’s necessary: Acts as a standalone safety mechanism and visual reference point for immediate grow room access.
- Key Spec: Programmable audible alarm for high concentration thresholds.
System Integration and Data Logging Architecture
The ability to aggregate environmental data over a complete crop cycle reveals long-term trends and systemic inefficiencies that are impossible to spot during manual walk-throughs.
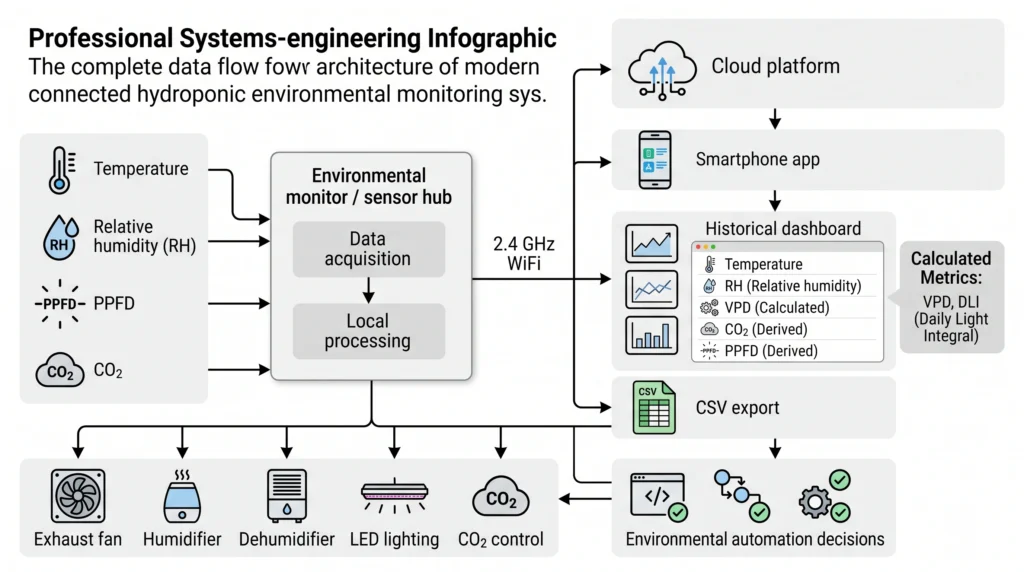
The hardware sensors inside the Pulse Pro generate massive datasets. The unit relies on 2.4GHz WiFi to push this data to a cloud-based dashboard. The app interface allows the operator to overlay different environmental metrics on the same graph. Viewing temperature and humidity on the same timeline instantly reveals how VPD reacts to the lights turning on or off.
A common issue observed in environmental data is the “humidity spike” that occurs immediately after the grow lights shut down. As the air cools, its capacity to hold water drops, causing relative humidity to spike rapidly. This creates a dangerous microclimate where condensation forms on plant tissue, inviting fungal pathogens like powdery mildew or botrytis. By reviewing the exported CSV data from the Pulse Pro, a grower can program their dehumidifier to activate twenty minutes before the lights shut off, effectively pre-drying the room to cushion the temperature drop.
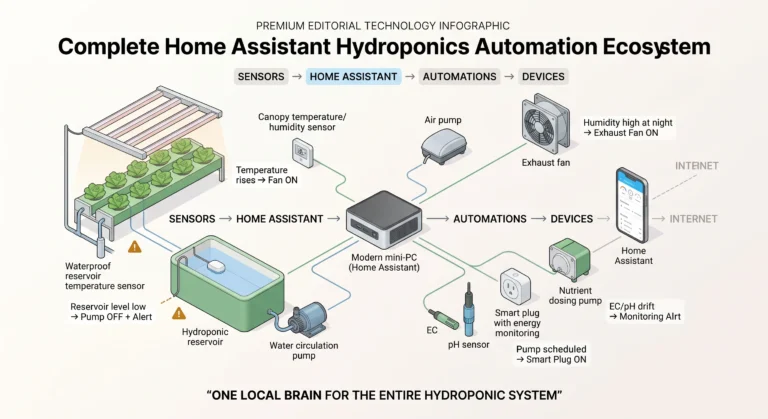
Tying this data logging into physical equipment execution requires reliable relay hardware. Modern environmental control relies on bridging the gap between monitoring software and physical pumps or fans. Exploring the integration of smart plugs timers for hydroponic infrastructure allows growers to automate equipment responses based on the baseline data established by the Pulse device.
Real-World Applications: Commercial Facilities vs. DIY Tents
Scaling environmental monitoring requires mapping the specific microclimates that form within different spaces. A single sensor array operates differently in a small tent compared to an expansive warehouse.
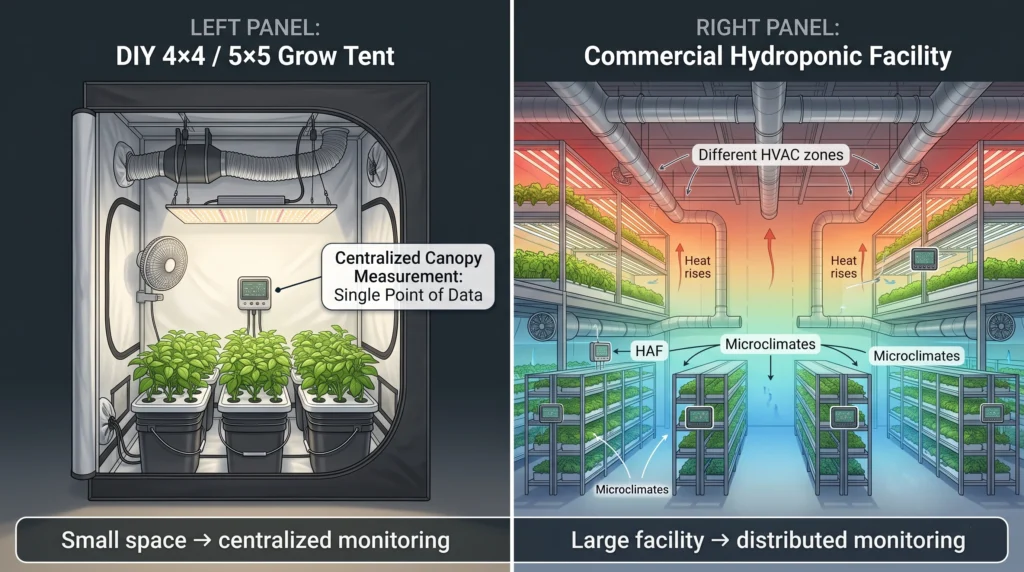
In a residential setting, setting up a 4×4 or 5×5 tent requires centralized monitoring to prevent extreme temperature swings. A single Pulse Pro unit hung in the geometric center of the canopy provides sufficient data to run the entire tent. The reflective walls and tight proximity to the exhaust fan ensure the air is mixed relatively well, meaning a reading in the center accurately reflects the corners. Selecting an appropriate structure to house the environment is the first step, and following a grow tent buying guide ensures the chosen material can retain the desired climate parameters without leaking air or light.
Commercial facilities present an entirely different fluid dynamics challenge. Warehouses experience severe air stratification. Heat rises, causing the upper tiers of vertical racks to experience higher temperatures and lower humidity than the floor-level beds. Massive air conditioning handlers blow cold air down specific aisles, creating high-VPD pockets.
In commercial settings, relying on a single environmental monitor guarantees crop failure in the unmonitored zones. Growers must deploy a grid of monitors to map the facility’s microclimates. One Pulse Pro should be placed in every distinct HVAC zone, and sensors must be placed at different vertical heights to assess the efficiency of the horizontal airflow fans. If the data shows a 5-degree temperature variance between the floor and the ceiling, the facility must increase vertical air mixing.
Installation, Calibration, and Troubleshooting Protocols
Maintaining sensor accuracy demands strict adherence to installation guidelines. Improper placement or neglected calibration routines will result in corrupted data and flawed environmental control.
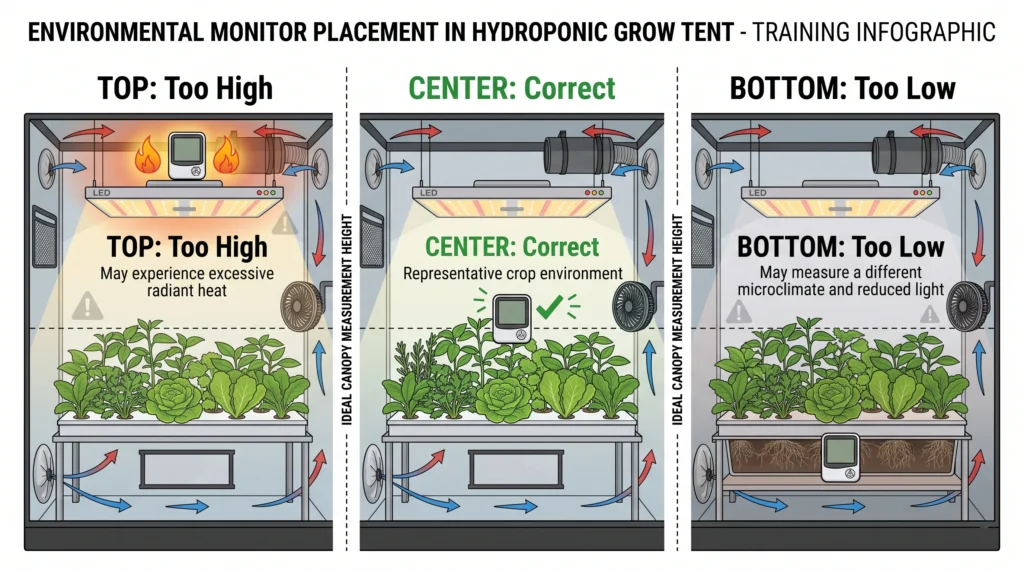
The physical placement of the monitor dictates the validity of the data. The unit must be hung at the exact height of the plant canopy. Hanging the device above the lights will register temperatures significantly higher than what the plants experience. Dropping the sensor below the canopy into the shaded undergrowth will register artificially high humidity levels and zero PPFD. As the plants grow taller week by week, the monitor must be raised sequentially.
Hardware sensors experience drift over extended periods. The NDIR CO2 sensor utilizes an automatic background calibration feature. It assumes that the lowest CO2 reading recorded over a 7-day period equates to the global atmospheric baseline of 400 ppm. If the growing environment is heavily sealed and never drops to 400 ppm, the sensor will artificially recalibrate its baseline to a higher number, skewing all future readings. To prevent this, the room must be flushed with fresh outside air for at least one hour every week, or the unit must be taken outside to reset.
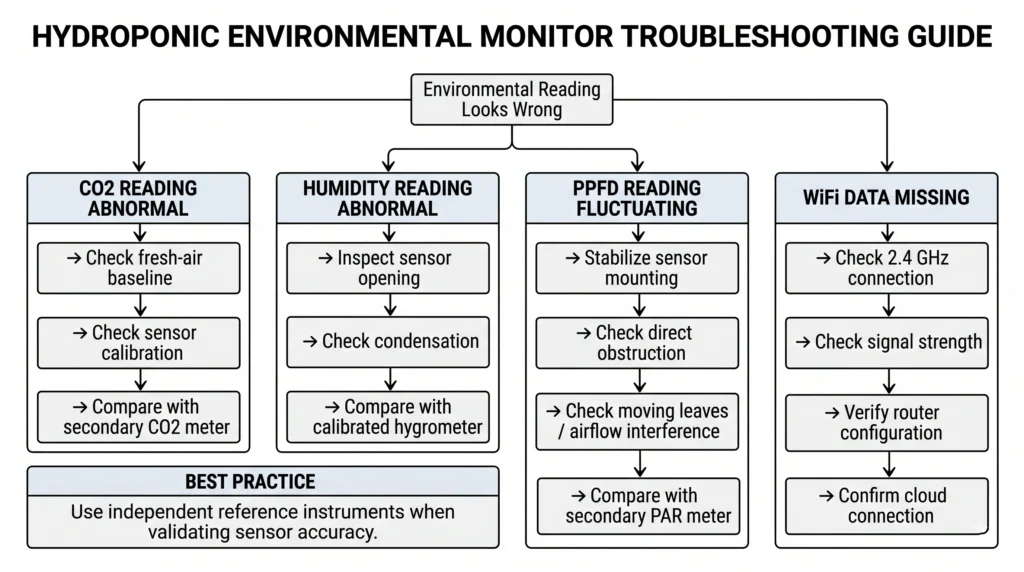
Networking issues frequently disrupt continuous logging. The device requires a dedicated 2.4GHz WiFi band. Dual-band routers that automatically switch between 2.4GHz and 5GHz often drop the device’s connection. Separating the bands in the router settings and assigning the monitor strictly to the 2.4GHz network resolves 90% of connectivity drops. If the data output looks erratic or liquid nutrients have splashed the sensors, consulting a comprehensive hydroponic troubleshooting guide
helps diagnose hardware failures versus simple environmental anomalies. Comparing sensor readouts against standalone meters can also isolate calibration drift. An extensive ph ec meter showdown 2025 provides context on why relying on multiple points of verification is standard practice for precision agriculture.
Frequently Asked Questions
How does the Pulse Pro determine leaf temperature for its VPD calculation?
The monitor relies on a user-defined leaf temperature offset rather than an integrated infrared camera. Because leaf temperature is consistently cooler than ambient air due to transpirational cooling, the user inputs a negative offset (e.g., -2.0 degrees) based on manual spot-checks with a handheld IR thermometer. The device applies this mathematical offset to the ambient temperature reading when computing the saturation vapor pressure for the VPD formula.
Why is my PPFD reading fluctuating rapidly when the lights are stationary?
Rapid fluctuations in PPFD are typically caused by physical interference near the spectrometer dome. If the device is hanging on a swinging cord, or if horizontal airflow fans are blowing plant leaves back and forth directly over the sensor dome, the light interception will change second by second. The unit must be rigidly mounted on a fixed pole or heavy chain to stabilize the incoming photon count.
How do I prevent the CO2 sensor from auto-calibrating incorrectly in a sealed room?
NDIR sensors use Automatic Baseline Calibration (ABC), which resets the lowest recorded reading to 400 ppm. In a sealed room supplemented with CO2, the levels may never drop to 400 ppm. You must manually disable the ABC feature in the app settings for sealed rooms. Once disabled, you will need to physically remove the unit to a fresh outdoor environment every 3 to 6 months to perform a manual calibration reset.
Can the Pulse Pro withstand the high humidity of aeroponic propagation environments?
While the internal circuitry is conformally coated against moisture, the physical sensor grilles must remain unblocked. In high-pressure aeroponics or heavy fogging environments where liquid water droplets condense on surfaces, the sensor arrays can become temporarily blinded. Continuous exposure to condensing water (100% RH) will degrade the humidity capacitance sensor over time. The unit must be shielded from direct misting nozzles.
What is the maximum light intensity the spectrometer can accurately record?
The spectrometer is calibrated to read PAR (400-700nm) accurately up to 3000 μmol/m2/s. This ceiling is significantly higher than any commercially viable crop can withstand (most fruiting crops max out at 1500 μmol/m2/s before severe photoinhibition occurs). The high ceiling ensures that peak intensity measurements from high-wattage LED arrays mounted close to the canopy will not clip or max out the sensor.
How do I extract my environmental data for external spreadsheet analysis?
The Pulse dashboard allows users to export all historical data in a standard CSV format. This data can be imported directly into Excel or Google Sheets. Extracting data allows operators to correlate specific VPD and DLI integrals against final crop dry weights, enabling precise adjustments for the next harvest cycle based on historical yield performance.
Final System Assessment
Achieving maximum yield potential inside a controlled environment requires exact metrics. The Pulse Pro Environmental Monitor transitions a grow room from a guessing game into a quantifiable data laboratory. By actively measuring PPFD, growers can tune their lighting layouts to avoid wasted energy and prevent light stress. The integrated NDIR CO2 sensor ensures that expensive gas supplementation is actually hitting target thresholds, while the automated VPD calculations keep stomata open and nutrient transport flowing smoothly.
Maintaining this level of control prevents the cascading failures that stem from simple temperature or humidity spikes. Operators looking to expand their knowledge on atmospheric integration and advanced hardware setups should navigate to our comprehensive tools and resources repository for further engineering blueprints and calculator utilities.

Continue Your Learning Journey